
腹部CT扫描中L1椎体CT值在骨质疏松机会性筛查中的价值
L1 Vertebral CT Attenuation Value in Abdominal CT Scanning for the Opportunistic Screening of Osteoporosis
-
摘要:
目的:研究常规腹部CT扫描中L1椎体CT值对骨质疏松机会性筛查的可行性及诊断价值。方法:选取腹部CT检查的
1117 例患者,测量其L1、L2椎体的CT值和QCT骨密度(BMD)值,根据BMD值分为骨量正常组、骨量减低组、骨质疏松组。分析椎体CT值与BMD的相关性,由2名测量者随机抽取30例患者在相隔2周的两个时间点测量L1椎体CT值,分析组间和组内测量的一致性。应用Bland-Altman图分析CT值测量与QCT测量两者测量方法的一致性,应用受试者工作特征(ROC)曲线评估椎体CT值预测骨质疏松和骨量正常的诊断效能。结果:L1、L2椎体CT值与BMD值呈显著正相关(r=0.956,r=0.902,P均<0.01)。测量者的一致性分析显示两位测量者具有很高的组间一致性和组内一致性(ICC=0.985,ICC=0.995)。Bland-Altman图分析显示CT值测量与QCT测量两者测量方法具有良好的一致性。L1、L2椎体及L1与L2椎体平均CT值对预测骨质疏松和骨量正常具有很高的诊断效能,诊断骨质疏松的曲线下面积(AUC)分别为0.982、0.977和0.984,诊断低BMD的AUC分别为0.969、0.964和0.970。L1椎体CT值预测骨质疏松和骨量正常的CT阈值分别为106.33HU和149.33HU。结论:腹部CT扫描中L1椎体CT值对机会性筛查骨质疏松具有较高的可靠性及诊断价值,L1椎体CT值可以用于机会性筛查骨质疏松。Abstract:Objective: This study investigates the feasibility and diagnostic value of L1 vertebral computed tomography (CT) attenuation for the opportunistic screening of osteoporosis via routine abdominal CT scans. Methods: Data from
1117 patients who underwent quantitative computed tomography (QCT) and abdominal CT were analyzed retrospectively. The bone mineral density (BMD) and CT attenuation values of the L1 and L2 vertebrae were measured, and patients were divided into three groups according to the BMD measured using QCT: osteoporosis, osteopenia, or normal BMD. The correlation between the two measurements was analyzed. The L1 attenuation CT value was measured by two observers at two time points separated by at least two weeks. Bland–Altman plots were used to assess the agreement between the predicted and measured QCT values. Receiver operating characteristic (ROC) curves were generated to determine the optimal diagnostic thresholds and the area under the curve (AUC). Results: The L1 and L2 vertebral CT attenuation values correlated well with the QCT BMD values (correlation coefficients of 0.956 and 0.902; all P < 0.001). There was excellent intra- and interobserver agreement in the L1 vertebral attenuation CT value measurements (ICC = 0.995 and 0.985) for the two observers. An analysis of the Bland–Altman plot showed that there was good agreement between the predicted and measured QCT BMD values. The CT and mean CT attenuation values from the L1 and L2 vertebrae predicted osteoporosis and normal BMD with high accuracy. The CT attenuation values of the L1 and L2 vertebrae predicted osteoporosis and normal BMD with high accuracy but no significant differences. The AUC of the L1 and L2 vertebrae CT attenuation values and combined mean CT attenuation values of L1 and L2 for predicting osteoporosis were 0.982, 0.977, and 0.984, respectively, and those for predicting normal BMD were 0.969, 0.964, and 0.970, respectively. The optimal thresholds of the L1 vertebrae for predicting osteoporosis and normal BMD were 106.33 HU and 149.33 HU, respectively. Conclusion: L1 vertebral CT attenuation values on abdominal CT scans are highly reliable and valuable for opportunistic osteoporosis screening. Thus, the L1 vertebral attenuation CT value can be used for opportunistic osteoporosis screening. -
骨质疏松症(osteoporosis,OP)是以骨密度减低和骨脆性增加为特征的代谢性骨病,易发生脆性骨折,具有较高的发病率和死亡率。近年来,随着我国人口老龄化,OP的流行率稳步增加。OP相关的脆性骨折具有高住院率、高护理费用和养老院依赖性,已经成为人们普遍关注的一个主要公共卫生问题[1]。尽管OP具有公共性和严重性,仍然存在诊断和治疗不足的问题。
双能X射线吸收仪(dual energy X-ray absorptiometry,DEXA)测量骨密度(bone mineral density,BMD)是目前公认的诊断OP参考标准,推荐所有65岁以上的女性和所有70岁以上的男性进行DEXA检查。目前只有不到33%的女性和5%的男性脆性骨折患者接受DEXA评估[2],而且,DEXA不能区分骨皮质与骨松质,检查结果易受到椎体骨质增生,椎体周围血管钙化的影响,导致骨密度假性增高。定量CT(quantitative computed tomography,QCT)检查也是BMD检查的常用方法,能够分别测量椎体骨松质及骨皮质的BMD,测量结果不受骨质增生及血管钙化的影响,缺点为需要专门的测量软件,单独进行BMD测量辐射剂量较高,使其在基层医院的应用受到限制。近年来,对由于其他适应症而进行CT扫描的图像进行BMD分析作为OP的机会筛查手段得到了人们的关注,CT检查提供的OP机会性筛查的优点是对患者没有额外的X线辐射及费用。以DEXA检查结果为标准,分析腰1椎体CT值预测骨质疏松的研究已有报道,但是,以QCT检查结果为标准,分析腰1椎体CT值预测骨质疏松的研究鲜见报道[3]。
本研究旨在分析腰1椎体CT值与QCT BMD的相关性并评价腰1椎体CT值对机会性筛查OP的可靠性及效能。
1. 资料与方法
1.1 研究对象
回顾性分析2020年7月至2023年1月因其它临床适应症进行腹部CT平扫的
1117 例,患者年龄范围30~90岁,平均年龄(62.45±10.36)岁,其中,男583例,平均年龄(61.61±11.11)岁,女534例,平均年龄(63.37±9.39)岁。纳入标准:年龄范围30~90岁,采用120 kV的扫描条件。排除标准:包括椎体肿瘤,腰椎外伤、L1椎体骨折,椎体畸形,椎体内金属植入物,椎体成形术后,影响BMD的内分泌及代谢性疾病。本研究通过医院伦理委员会审查,因系回顾性研究,知情同意书被免除。
1.2 检查方法
1.2.1 CT检查方法
使用飞利浦64排CT扫描仪(Incisive CT,飞利浦医疗系统)。采集参数如下:管电压120 kV,管电流260~300 mA,FOV 500×500 mm,矩阵512×512。CT图像重建采用标准重建算法,重建层厚为1 mm。
1.2.2 腰椎CT值测量
将CT数据传输到PACS工作站,观察腰椎图像的窗宽
1500 ,窗位300,测量L1、L2椎体CT值,在层厚为1 mm的轴位CT图像上选取椭圆形兴趣区(region of interest,ROI)分别位于椎体的中间平面、上部终板的下方层面和下部终板的上方层面的骨松质内,不包括骨岛、海绵状血管瘤及椎体后中央静脉走行区。取上述3个层面的CT值为椎体的平均CT值(图1)。为了评估测量方法的可重复性,自1117 例患者中随机抽取30例,有2名医生在不同时间点(相隔2周)分别2次测量L1椎体CT值。1.2.3 QCT 椎体BMD检查及测量
使用Mindways公司的QCT pro 5.0.3(QCT pro,Mindways Software,Inc.)非同步体模扫描技术进行QCT检查及测量,按QCT操作手册说明每天进行一次体模CT扫描并用图像分析系统进行指控分析。将CT数据传输到QCT工作站行BMD测量。椭圆形的ROI位于每个椎体(L1-L2)的中间平面的骨松质骨,不包括皮质骨、椎体后中央静脉走行区和任何硬化性病灶。
1.2.4 诊断标准
根据骨质疏松的影像学与骨密度诊断专家共识[4],腰椎QCT诊断标准如下:取2个腰椎椎体(第1和第2腰椎)松质骨骨密度平均值,≥120 mg/cm3的骨密度为正常,介于80 mg/cm3和120 mg/cm3之间的骨密度为骨量减少,≤80 mg/cm3的骨密度为骨质疏松。
1.3 统计学分析
使用SPSS 19.0统计软件进行分析。结果以
$ (\bar x \pm s)$ 表示,采用单因素方差分析比较组间检测结果,满足方差齐性应用LSD多重比较,方差不齐应用Tamhance比较。应用Pearson相关性检验分析椎体CT值与腰椎BMD的相关性。绘制受试者工作特征(receiver operating characteristic,ROC)曲线,采用Youden指数确定预测骨质疏松和骨量正常的阈值,计算灵敏度、特异度及曲线下面积(area under the curve,AUC)评估椎体CT值对OP的预测性能。应用组内相关系数(intraclass correlation coefficient,ICC)分析CT测量的测量者内一致性和测量者间一致性,ICC值>0.8表示一致性可靠。应用Bland-Altman图分析CT值测量于QCT两者测量方法的一致性,以两者方法测量的BMD的平均值为横坐标,以二者的差值为纵坐标,并以差值的均数±1.96倍差值的标准差(SD)为一致性界限。P<0.05为差异有统计学意义。2. 结果
2.1 研究人群的基线特征
QCT腰椎BMD测量结果示,
1117 例患者中,骨量正常组267例,骨量减少组472例,骨质疏松组378例。L1和L2椎体平均CT值分别为(126.03±43.75)HU和(120.42±45.28)HU,OP组平均CT值分别为(80.40±20.99)HU和(75.25±30.42)HU,骨量减少组为(131.73±18.86)HU和(126.40±19.94)HU,骨量正常组为(180.24±28.85)HU和(173.82±27.61)HU,3组间CT值差异有统计学意义(表1)。表 1 3组患者腰椎CT值及BMD值比较Table 1. Comparison of lumbar CT and BMD values among three groups of patients分组 OP组(378例) 骨量减少(472例) 正常组(267例) F p L1 CT值/HU 80.54±21.16 131.76±18.87 180.29±28.45 1598.663 0.000abc L1 BMD值/(mg/cm3) 62.53±16.41 103.07±12.42 144.03±19.36 2136.773 0.000abc L2 CT值/HU 75.25±30.42 126.40±19.94 173.82±27.61 1167.846 0.000abc L2 BMD值/(mg/cm3) 57.42±17.13 97.84±11.93 138.96±19.69 2088.040 0.000abc L1、L2平均CT值/HU 77.89±22.72 129.08±18.06 177.05±27.38 1593.007 0.000abc L1、L2平均BMD值/(mg/cm3) 59.89±16.02 100.45±10.89 141.49±19.02 2360.898 0.000abc 注:a为OP组与骨量减少组,b为骨量减少组与骨量正常组,c为OP组与骨量正常组。 2.2 椎体CT值与BMD的相关性
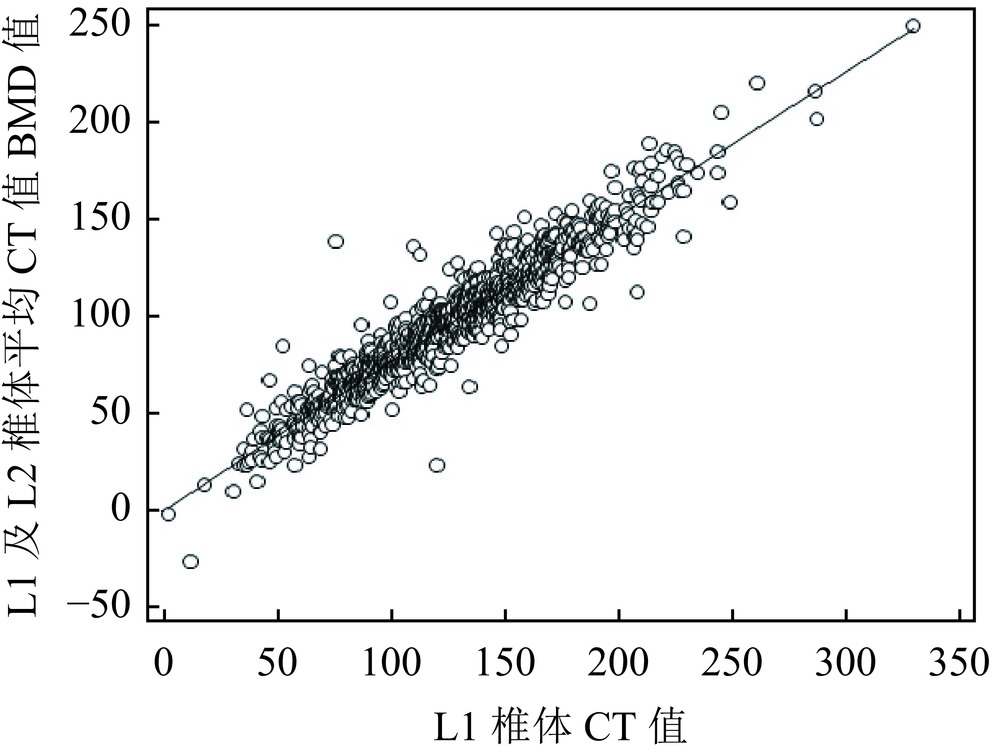
L1及L2椎体CT值与QCT测量的BMD值呈明显的正相关,相关系数分别为(r=0.956,r =0.902,P均<0.01)。L1椎体CT值与L1和L2的平均BMD值呈明显的正相关(r=0.954,P<0.01)(图2)。
![]() 图 2 L1椎体CT值与L1及L2椎体平均BMD的相关性Figure 2. Correlation between the L1 vertebral CT value and mean BMD of the L1 and L2 vertebral bodies
图 2 L1椎体CT值与L1及L2椎体平均BMD的相关性Figure 2. Correlation between the L1 vertebral CT value and mean BMD of the L1 and L2 vertebral bodies2.3 测量者的一致性分析
L1椎体CT值测量具有较高的可靠性,同一测量者不同时间点测量L1椎体CT值的组内相关系数ICC=0.995(P<0.01;95% CI:0.990~0.998),两名测量者间的组间相关系数ICC=0.985(P<0.01;95% CI:0.968~0.993)。
2.4 L1椎体CT值预测BMD的方程
以QCT测量的L1椎体BMD结果为因变量,L1椎体CT值(HU)为变量,得出根据CT值预测BMD的线性回归方程为:BMD(QCT)=0.75 X(HU)+4.26。
2.5 QCT测量BMD与预测BMD的Bland-Altman图比较
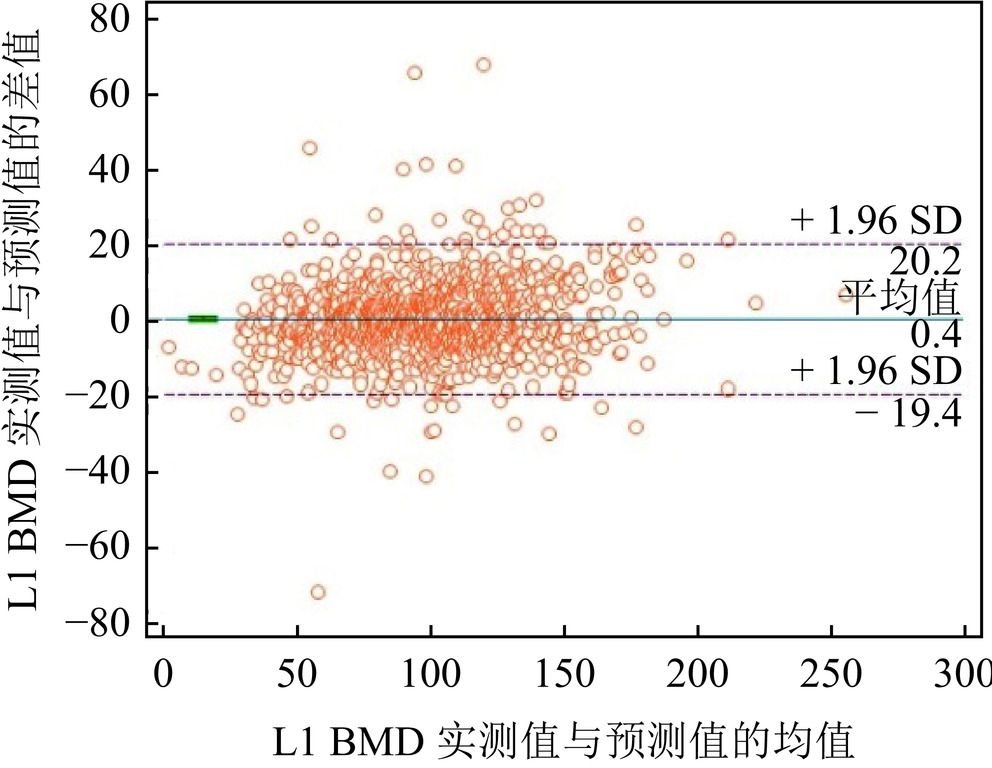
Pearson相关分析显示QCT测量的L1椎体BMD与由L1椎体CT值预测的BMD明显相关(r=0.956,P<0.01)。Bland-Altman图显示两种方法测量结果的平均差值非常接近于0,两种方法测量值的差异无统计学意义(图3)。
![]() 图 3 QCT测量BMD与预测BMD的Bland-Altman图Figure 3. Bland–Altman plot for the predicted and measured QCT values
图 3 QCT测量BMD与预测BMD的Bland-Altman图Figure 3. Bland–Altman plot for the predicted and measured QCT values2.6 腰椎CT值对预测OP的诊断效能
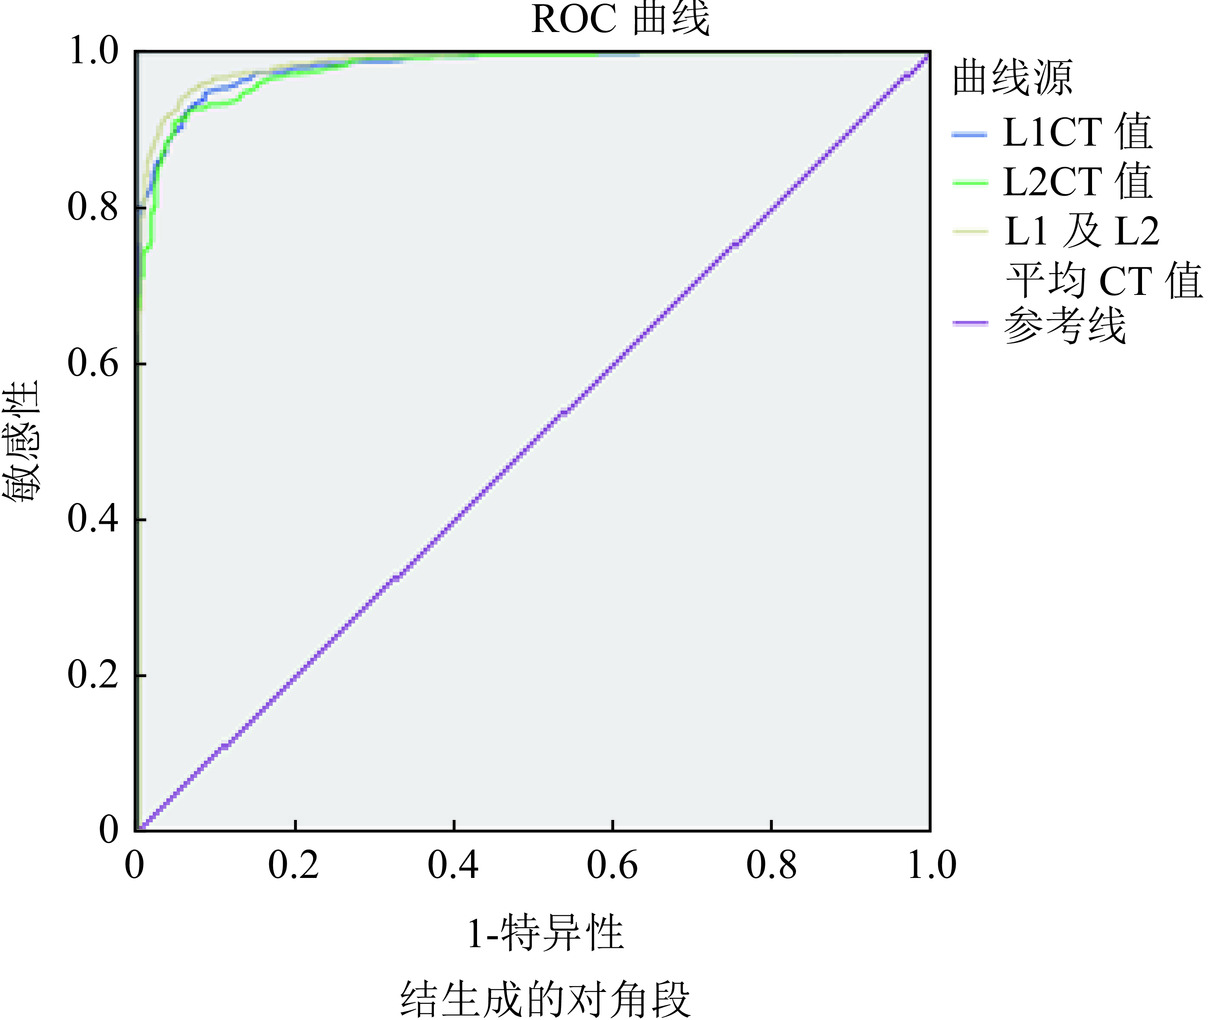
ROC曲线分析显示L1、L2椎体CT值及L1、L2椎体平均CT值区分骨质疏松与非骨质疏松(骨量正常+骨量减少)的阈值分别为106.33 HU、106.33 HU和105.83 HU,AUC值分别为0.982、0.977和0.984(表2和图4)。L1、L2椎体CT值及L1、L2椎体平均CT值区分骨量正常和低BMD(骨量减少+骨质疏松)的阈值分别为149.33 HU,144.00 HU和148.33 HU,AUC值分别为0.969、0.964和0.970,敏感度为90.70%,89.9%和91.5%,特异度为92.5%、88.80%和91.5%。
表 2 L1、L2及L1和L2 椎体平均CT值预测骨质疏松的效能Table 2. Efficacy of predicting osteoporosis based on the L1CT, L2CT, and mean CT values of L1 and L2分类 敏感度 特异度 阈值 AUC P L1CT值/HU 91.3 94.7 106.33 0.981 <0.001 L2CT值/HU 95.2 90.9 106.33 0.977 <0.001 L1、L2平均
CT值/HU94.4 93.9 105.83 0.984 <0.001 ![]() 图 4 L1CT值、L2CT值和L1、L2平均CT值预测骨质疏松的ROC曲线Figure 4. Fig.4 ROC curves for predicting osteoporosis based on the L1CT, L2CT, and mean CT values of L1 and L2, respectively
图 4 L1CT值、L2CT值和L1、L2平均CT值预测骨质疏松的ROC曲线Figure 4. Fig.4 ROC curves for predicting osteoporosis based on the L1CT, L2CT, and mean CT values of L1 and L2, respectively3. 讨论
有学者研究表明,L1椎体CT值与DEXA检查的T值呈中等程度相关性,相关系数为0.35~0.703[5−6],本研究表明,L1椎体CT值与QCT检查的BMD呈明显相关,相关系数为0.954。有研究显示QCT检查发现骨质疏松的敏感度和特异度明显高于DEXA检查,其主要原因是DEXA检查是二维检查,检查结果易受腰椎退行性变、腹部血管钙化等因素的影响,QCT检查测量的是椎体松质骨的体积BMD,其测量结果不受腰椎骨质增生、腹主动脉钙化、腰椎侧弯和体重等因素的影响[5,7]。因此,L1椎体CT值与QCT检查的BMD相关性高于与DEXA检查T值的相关性。
本研究显示在轴位图像上L1椎体CT值测量具有良好的组间一致性和组内一致性,与文献报道基本一致[3]。本研究中Bland-Altman图显示L1椎体QCT测量的BMD与由L1椎体CT值预测的BMD的差异无统计学意义,说明L1椎体CT值测量具有高度可靠性。Buenger等[8]研究显示横轴位、矢状位及冠状位测量L1椎体CT值无显著性差异。不同CT设备测量的腰椎CT值及QCT骨密度值无显著性差异[9−10]。Mooney等[11]研究显示不同CT设备(飞利浦CT扫描仪和GE CT扫描仪)间L1椎体CT值具有很高的组间一致性,ICC为0.91。胸部CT或腹部CT扫描均包含有L1椎体,一项meta分析[12]显示使用胸部CT和腹部CT两种不同的检查参数,所测L1椎体CT值对于诊断骨质疏松的敏感度和特异度无显著性差异。L1椎体紧邻与肋骨相关节的胸12椎体,容易识别,而且,测量L1椎体CT值具有方法简单,不需要模体校正,所需的测量时间短,方便易行,可重复性高等优点,因此,L1椎体可以作为测量CT值筛查骨质疏松的理想部位[8,11−13]。
Chia等[6]对一组50例增强CT扫描患者研究显示L1椎体CT值区分OP和非OP的AUC值为0.93,敏感度和特异度分别为80%和100%。Yao等[14]研究结果显示L1椎体CT值区分骨量正常和低骨量的AUC值0.83,敏感度为73%,特异度为86%。本组
1117 例腹部CT平扫患者中有378例为OP,其L1椎体CT值区分OP和非OP的AUC值为0.982,敏感度和特异度分别为91.3%和94.7%,区分骨量正常和低骨量的AUC值0.969。本组研究AUC值稍高或明显高于文献[6,14]报道的结果,究其原因可能是OP诊断标准的不同,本研究使用QCT测量BMD为诊断标准,而文献[6,14]均采用DEXA测量BMD为标准,此外,是否增强CT扫描、不同种族及研究人群的性别与年龄等也是影响椎体CT值及诊断效能的因素[7]。国内外关于L1椎体诊断OP的CT阈值也有一些报道,Wang等[15]对一组482例肺癌筛查的受试者研究显示,以QCT检查BMD为标准L1椎体CT值诊断OP的阈值为102.4 HU,章玲惠等[7]以QCT检查为标准对261例胸部低剂量CT扫描的受试者的研究显示,L1椎体诊断OP的阈值为93.36 HU,而王力平等[16]的阈值为98 HU,本组研究中OP阈值为106.33 HU,与Wang等[15]的研究结果基本一致。CT扫描kV对骨小梁CT值的影响明显高于对软组织CT值的影响,扫描kV增加,椎体CT值降低。Garner等[17]使用双能CT扫描研究显示使用80 kV和140 kV扫描时L1椎体CT值分别是194.9 HU和118.5 HU,多数学者推荐使用120 kV进行胸腹部CT扫描[6,18],而且QCT检查诊断OP的标准中也要求采用120 kV的扫描条件。因此,本研究均采用120 kV进行腹部CT扫描。测量椎体CT值所用的图像重建层厚目前尚无统一的标准,采用1~5 mm重建层厚均有报道,多数采用1~1.25 mm重建层厚[5,7,14−15]。王鹏勇等[19]对90例腰椎BMD测量者的原始CT图像进行回顾性分析,分别以0.625、1.25和2.5 mm重建层厚完成QCT椎体骨密度测量,结果显示不同重建层厚间腰椎骨密度均值差异无统计学意义。
本研究发现在轴位L1椎体CT值测量时,平行于终板的椎体中部水平层面骨小梁较其上下层面更致密,CT值更高,尤其是在低BMD的患者更加明显,与文献[10]报道一致,基于此,我们选择在轴位椎体图像上的椎体中部层面、上部终板的下方层面及下部终板的上方层面选取ROI,取上述3个平面的平均CT值作为L1椎体的CT值。由于腰椎QCT骨密度诊断OP标准中取2个腰椎椎体(第1和第2腰椎)松质骨骨密度平均值,小于80 mg/cm3的骨密度为骨质疏松[4],本研究对L1椎体CT值与L1、L2平均CT值在预测OP性能进行了比较,结果显示AUC值分别为0.982和0.984,两者均有非常高的诊断效能。
本研究存在一定的限度。①本研究为单中心的回顾性研究,存在地域上的选择偏倚,代表性可能不足;②没有对不同性别及种族椎体CT值诊断骨质疏松的效能进行分析;③选择人群的年龄偏倚,本组患者平均年龄为62.45岁。
综上所述,常规腹部CT扫描L1椎体CT值测量具有较高的组间及组内可靠性,L1椎体CT值与QCT检查的BMD呈明显的相关性,L1椎体CT值预测OP准确性高,区分OP与非OP的CT阈值是106.33 HU,AUC值0.982。对于缺少DEXA及QCT设备的基层医院,应用常规腹部CT测量L1椎体CT值进行OP机会性筛查是可行的。鉴于目前仍然普遍存在OP诊断和治疗不足的问题,我们建议在常规腹部CT的报告中增加L1椎体CT值的内容,对于CT值达到OP阈值的患者,建议进一步行DEXA或QCT检查确诊有无OP,达到早期诊断早期治疗的目的。
-
![]()
图 2 L1椎体CT值与L1及L2椎体平均BMD的相关性
Figure 2. Correlation between the L1 vertebral CT value and mean BMD of the L1 and L2 vertebral bodies
![]()
图 3 QCT测量BMD与预测BMD的Bland-Altman图
Figure 3. Bland–Altman plot for the predicted and measured QCT values
![]()
图 4 L1CT值、L2CT值和L1、L2平均CT值预测骨质疏松的ROC曲线
Figure 4. Fig.4 ROC curves for predicting osteoporosis based on the L1CT, L2CT, and mean CT values of L1 and L2, respectively
表 1 3组患者腰椎CT值及BMD值比较
Table 1 Comparison of lumbar CT and BMD values among three groups of patients
分组 OP组(378例) 骨量减少(472例) 正常组(267例) F p L1 CT值/HU 80.54±21.16 131.76±18.87 180.29±28.45 1598.663 0.000abc L1 BMD值/(mg/cm3) 62.53±16.41 103.07±12.42 144.03±19.36 2136.773 0.000abc L2 CT值/HU 75.25±30.42 126.40±19.94 173.82±27.61 1167.846 0.000abc L2 BMD值/(mg/cm3) 57.42±17.13 97.84±11.93 138.96±19.69 2088.040 0.000abc L1、L2平均CT值/HU 77.89±22.72 129.08±18.06 177.05±27.38 1593.007 0.000abc L1、L2平均BMD值/(mg/cm3) 59.89±16.02 100.45±10.89 141.49±19.02 2360.898 0.000abc 注:a为OP组与骨量减少组,b为骨量减少组与骨量正常组,c为OP组与骨量正常组。  下载: 导出CSV
表 2 L1、L2及L1和L2 椎体平均CT值预测骨质疏松的效能
Table 2 Efficacy of predicting osteoporosis based on the L1CT, L2CT, and mean CT values of L1 and L2
分类 敏感度 特异度 阈值 AUC P L1CT值/HU 91.3 94.7 106.33 0.981 <0.001 L2CT值/HU 95.2 90.9 106.33 0.977 <0.001 L1、L2平均
CT值/HU94.4 93.9 105.83 0.984 <0.001
下载: 导出CSV
-
[1] PATEL N, DAHL K, O'ROURKE R, et al. Vertebral CT attenuation outperforms standard clinical fracture risk prediction tools in detecting osteoporotic disease in lung cancer screening participants[J]. The British Journal of Radiology, 2023, 96(1151): 20220992. DOI: 10.1259/bjr.20220992.
[2] EMOHARE O, DITTMER A, MORGAN R A, et al. Osteoporosis in acute fractures of the cervical spine: The role of opportunistic CT screening[J]. Journal of Neurosurgery Spine, 2015, 23(1): 1-7. DOI: 10.3171/2014.10.SPINE14233.
[3] GERETY E L, HOPPER M A, BEARCROFT P W. The reliability of measuring the density of the L1 vertebral body on CT imaging as a predictor of bone mineral density[J]. Clinical Radiology, 2017, 72(2): 177. e9-177. e15. DOI: 10.1016/j.crad.2016.09.022.
[4] 中华医学会放射学分会骨关节学组. 骨质疏松的影像学与骨密度诊断专家共识[J]. 中华放射学杂志, 2020, 54(8): 745-751. DOI: 10.3760/cma.j.cn112149-20200331-00485. Bone and Joint Group of Chinese Society of Radiology of Chinese Medical Association. Consensus on the diagnosis of osteoporosis by imaging and bone mineral densitymeasurement[J]. Chinese Journal of Radiology, 2020, 54(8): 745-751. DOI: 10.3760/cma.j.cn112149-20200331-00485.
[5] ABBOUCHIE H, RAJU N, LAMANNA A, et al. Screening for osteoporosis using L1 vertebral density on abdominal CT in an Australian population[J]. Clinical Radiology, 2022, 77(7): e540-e548. DOI: 10.1016/j.crad.2022.04.002.
[6] CHIA K K, HARON J, NIK MALEK N F S. Accuracy of computed tomography attenuation value of lumbar vertebra to assess bone mineral density[J]. The Malaysian Journal of Medical Sciences, 2021, 28(1): 41-45. DOI: 10.21315/mjms2021.28.1.6.
[7] 章玲惠, 卢向军, 何东, 等. 基于胸部低剂量CT扫描测量腰椎CT值机会性筛查骨质疏松[J]. 实用放射学杂志, 2023, 39(4): 626-630. DOI: 10.3969/j.issn.1002-1671.2023.04.027. ZHANG L H, LU X J, HE D, et al. OpportunisticscreeningofosteoporosisbasedonthemeasurementofCTvalueoflumbarspineusingchestlow-doseCT[J]. Journal of Practical Radiology, 2023, 39(4): 626-630. DOI: 10.3969/j.issn.1002-1671.2023.04.027.
[8] BUENGER F, ECKARDT N, SAKR Y, et al. Correlation of bone density values of quantitative computed tomography and hounsfield units measured in native computed tomography in 902 vertebral bodies[J]. World Neurosurgery, 2021, 151: e599-e606. DOI: 10.1016/j.wneu.2021.04.093.
[9] JANG S, GRAFFY PM, ZIEMLEWICZ TJ, et al. Opportunistic osteoporosis screening at routine abdominal and thoracic CT: Normative L1 trabecular attenuation values in more than 20000 adults[J]. Radiology, 2019, 291(2): 360-367. DOI: 10.1148/radiol.2019181648.
[10] ULLRICH BW, SCHWARZ F, MCLEAN AL, et al. Inter-rater reliability of hounsfield units as a measure of bone density: applications in the treatment of thoracolumbar fractures[J]. World Neurosurgery, 2022, 158: e711-e716. DOI: 10.1016/j.wneu.2021.11.043.
[11] MOONEY J, MORGAN S, BROCKINGTON D, et al. Inter-rater reliability and correlation of L1 hounsfield unit measurements with DXA scores[J]. Journal of Clinical Densitometry, 2022, 25(4): 668-673. DOI: 10.1016/j.jocd.2022.09.002.
[12] ZHU Y, TRIPHURIDET N, YIP R, et al. Opportunistic CT screening of osteoporosis on thoracic and lumbar spine: a meta-analysis[J]. C linical Imaging, 2021, 80: 382-390. DOI: 10.1016/j.clinimag.2021.08.005.
[13] ALAWI M, BEGUM A, HARRAZ M, et al. Dual-energy X-ray absorptiometry (DEXA) scan versus computed tomography for bone density assessment[J]. Cureus, 2021, 13(2): e13261. DOI: 10.7759/cureus.13261.
[14] YAO Q, LIU J, YUAN K, et al. Comparison of L1 CT-attenuation and cortical thickness in predicting osteoporosis by opportunistic CT[J]. Journal of X-Ray Science and echnology, 2022, 30(3): 631-640. DOI: 10.3233/XST-211106.
[15] WANG P, SHE W, MAO Z, et al. Use of routine computed tomography scans for detecting osteoporosis in thoracolumbar vertebral bodies[J]. Skeletal Radiology, 2021, 50(2): 371-379. DOI: 10.1007/s00256-020-03573-y.
[16] 王力平, 连天星, 胡永荣, 等. 胸部CT椎体HU值在2型糖尿病骨质疏松症机会性筛查中的价值[J]. 中国组织工程研究, 2024, 28(6): 950-954. DOI: 10.12307/2023.795. WANG L P, LIAN T X, HU Y R, et al. HU value of chest CT vertebral body in the opportunistic screening of type 2 diabetes mellitus osteoporosis[J]. Chinese Journal of Tissue Engineering Research, 2024, 28(6): 950-954. DOI: 10.12307/2023.795.
[17] GARNER H W, PATURZO M M, GAUDIER G, et al. Variation in attenuation in L1 trabecular bone at different tube voltages: Caution is warranted when screening for osteoporosis with the use of opportunistic CT[J]. American Journal of Roentgenology, 2017, 208(1): 165-170. DOI: 10.2214/AJR.16.16744.
[18] GRAFFY P M, LEE S J, ZIEMLEWICZ T J, et al. Prevalence of vertebral compression fractures on routine CT scans according to L1 trabecular attenuation: Determining relevant thresholds for opportunistic osteoporosis screening[J]. American Journal of Roentgenology, 2017, 209(3): 491-496. DOI: 10.2214/AJR.17.17853.
[19] 王勇朋, 阳琰, 何生生, 等. 不同重建层厚对定量CT椎体骨密度测量值的影响[J]. 放射学实践, 2018, 13(11): 1191-1193. DOI: 10.13609/j.cnki.1000-0313.2018.11.016. WANG Y P, YANG Y, HE S S, et al. Effect of different reconstruction slice thickness on vertebral bone mineral density using quantitative CT[J]. Radiology Practice, 2018, 13(11): 1191-1193. DOI: 10.13609/j.cnki.1000-0313.2018.11.016.


计量
- 文章访问数: 44
- HTML全文浏览量: 8
- PDF下载量: 5


