
Assessment of the Image Quality of Virtual Non-Contrast Dual-energy CT Liver Scans Using Both PSNR and SSIM Methods
-
摘要:
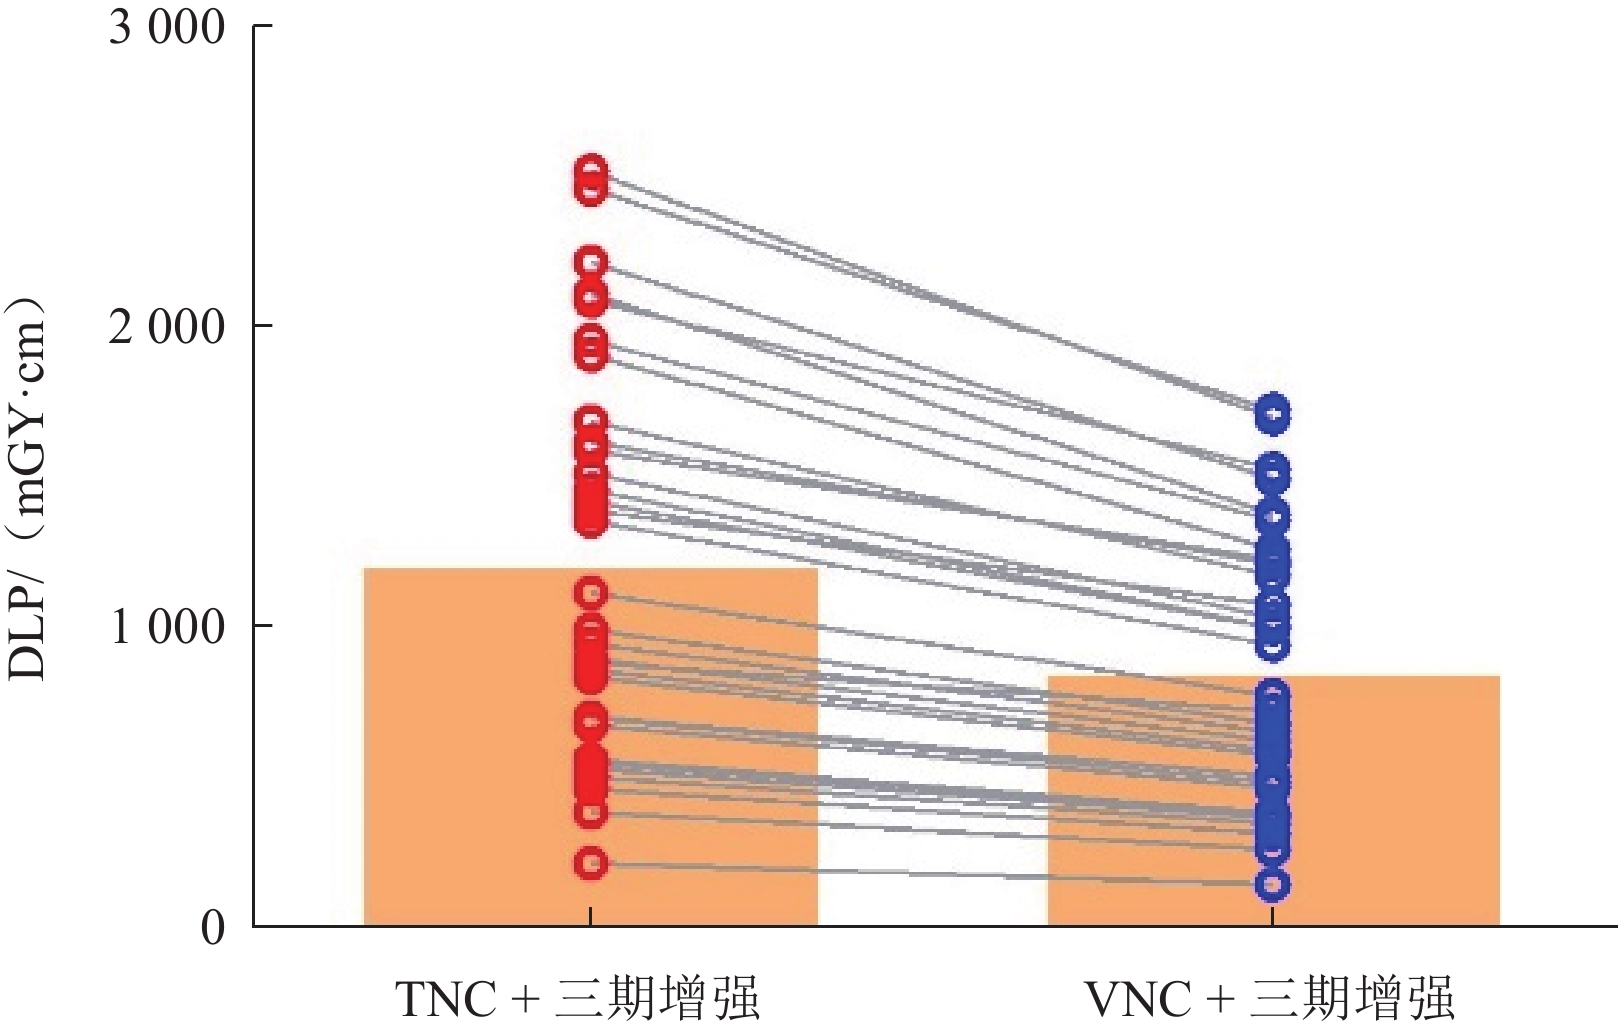
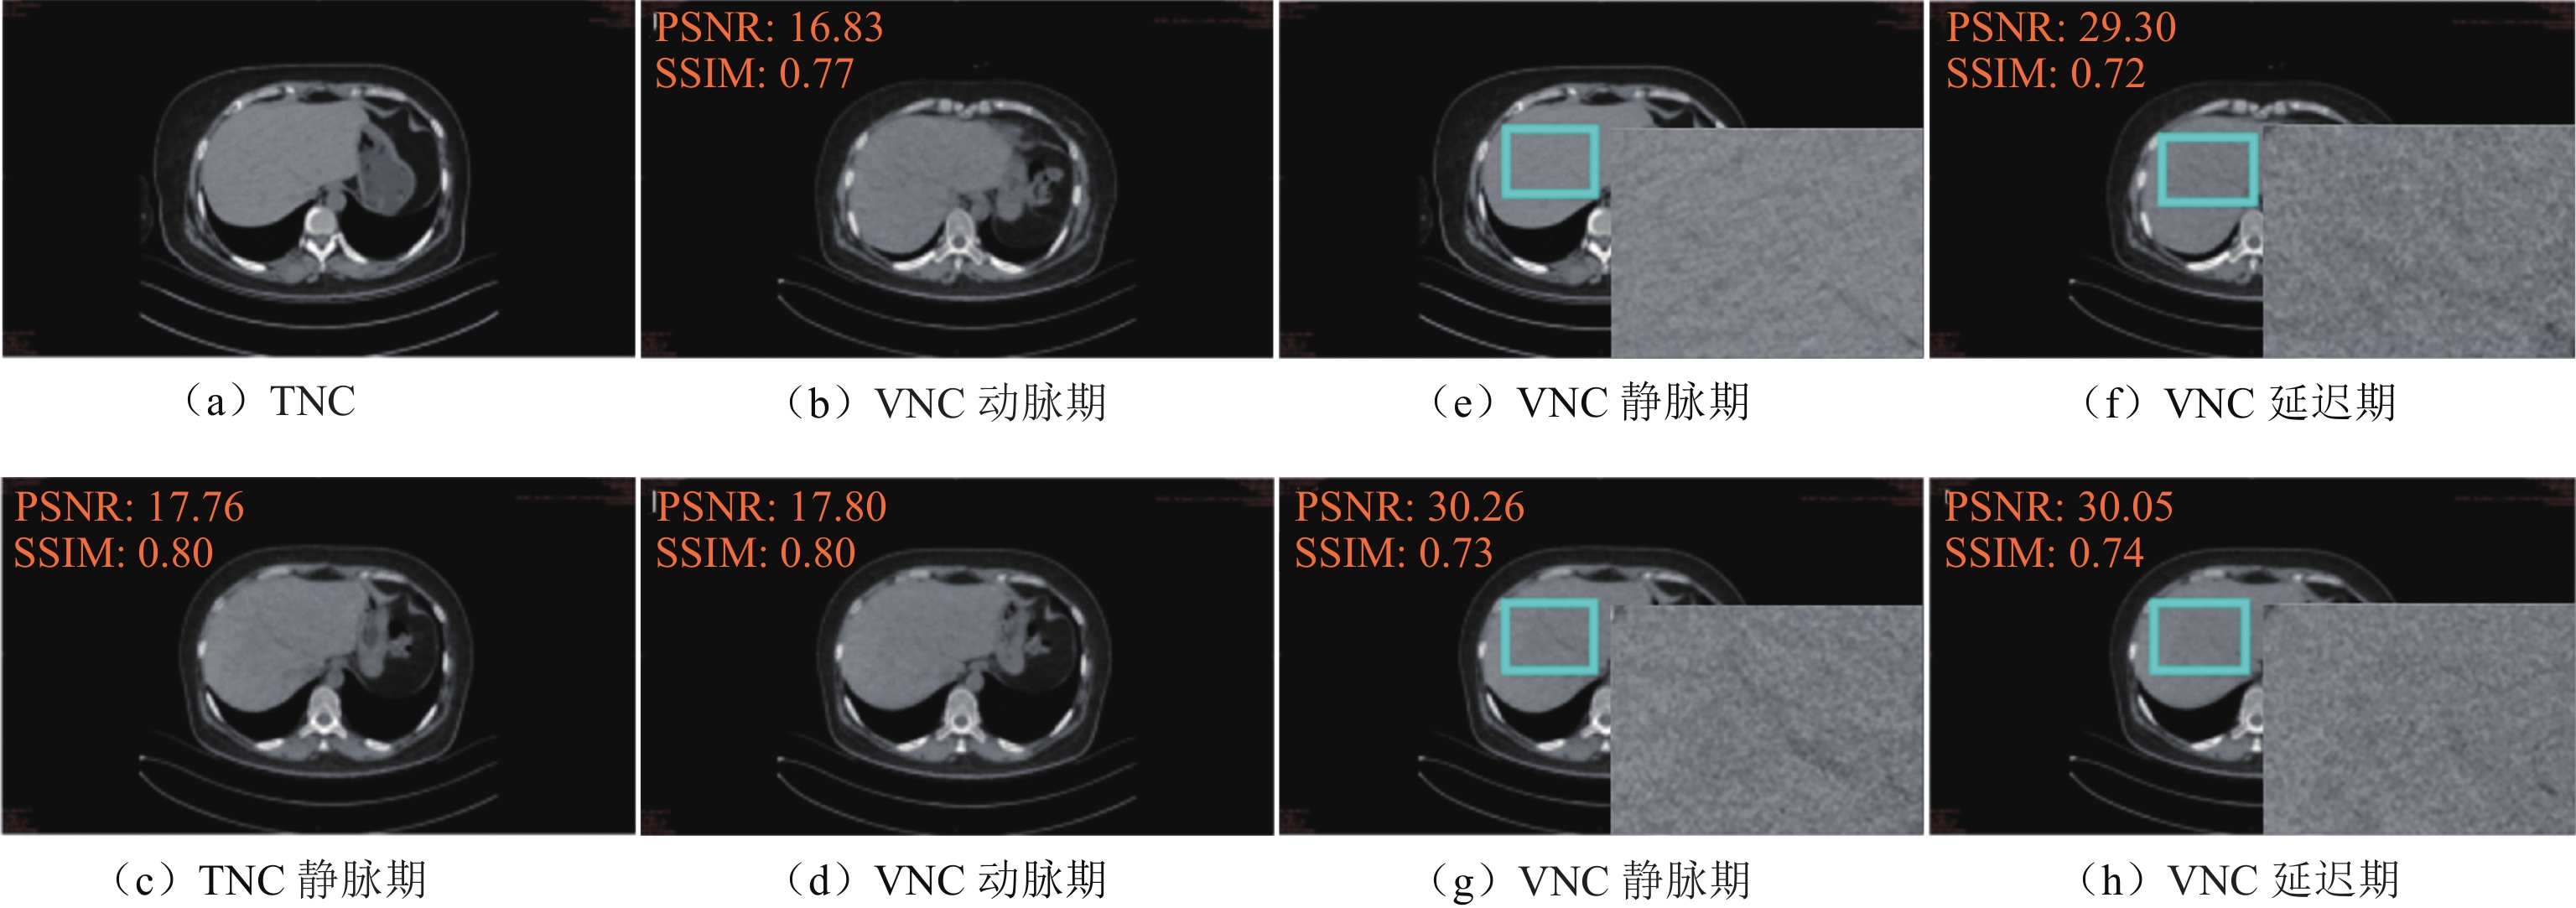
目的:采用峰值信噪比(PSNR)和结构相似性指数(SSIM)联合图像评价方法,探讨双能量CT的肝脏虚拟平扫(VNC)图像替代真实平扫(TNC)图像的可行性。方法:前瞻性分析33例肝脏CT平扫及Ⅲ期双能量增强扫描的影像学资料。经后处理获得动脉期VNC图像(VNCa)、静脉期VNC图像(VNCv)及延迟期VNC图像(VNCd)。将肝脏Ⅲ期VNC图像与TNC图像应用PSNR和SSIM方法进行整体及局部比对分析。测量肝脏及竖脊肌的CT值与噪声值(SD),计算信噪比(SNR)和对比噪声比(CNR),记录肝脏真实CT平扫及增强扫描的剂量长度乘积,比较Ⅲ期VNC与TNC图像质量的客观评价指标及辐射剂量,并绘制肝脏CT值、SNR和CNR的Bland-Altman散点图进行一致性分析。结果:整体图像评价Ⅲ期VNC与TNC图像比对的PSNR分别为(18.01±1.06)、(18.33±0.99)、(18.20±1.04),SSIM分别为(0.76±0.04)、(0.77±0.03)、(0.78±0.04);局部图像评价Ⅲ期VNC与TNC图像比对的PSNR为(29.90±2.50)、(30.97±2.34)、(30.61±2.76),SSIM为(0.75±0.04)、(0.77±0.03)、(0.77±0.04);Ⅲ 期VNC与TNC图像整体及局部比对的PSNR、SSIM的差异没有统计学意义。Ⅲ 期VNC的肝脏CT值高于TNC;Ⅲ 期VNC的CNR及VNCv的SNR与TNC图像相比无统计学差异;肝脏CT值、SNR及CNR在 Ⅲ 期VNC与TNC图像之间均具有良好的一致性。去除真实平扫环节,采用VNC+Ⅲ 期增强方案可降低约29.63%的辐射剂量。结论:双能量CT的肝脏VNC图像具有良好的图像质量,可以较真实地还原TNC图像,满足临床的诊断需求。
Abstract:The purpose of this study was to investigate the feasibility of replacing true non-contrast (TNC) dual-energy computed tomography (DECT) images with virtual non-contrast (VNC) DECT images by comparing their quality on the basis of both the peak signal-to-noise ratio (PSNR) and structural similarity index (SSIM). Methods: A prospective analysis was conducted on TNC and enhanced three-phase DECT images of the livers of 33 patients. Post-processing was used to obtain the arterial-phase (VNCa), venous-phase VNC (VNCv), and delayed-phase VNC (VNCd) images. Both the PSNR and SSIM methods were used to compare the overall and local TNC and three-phase VNC images. The CT numbers and noise values (standard deviation) of the liver and erector spinae muscle were measured, and the SNR and contrast-to-noise ratio (CNR) were calculated. The dose length product values of the TNC and enhanced three-phase VNC scans were recorded, and the objective evaluation indicators and radiation doses of the three-phase VNC and TNC images were compared. Bland-Altman scatter plots were drawn to analyze the consistency of the liver CT numbers, SNRs, and CNRs. Results: The overall comparison of the three-phase VNC and TNC images showed PSNR values of (18.01±1.06), (18.33±0.99), and (18.20±1.04) and SSIM values of (0.76±0.04), (0.77±0.03), and (0.78±0.04), with the differences being not statistically significant. The local comparison of these images showed PSNR values of (29.90±2.50), (30.97±2.34), and (30.61±2.76) and SSIM values of (0.75±0.04), (0.77±0.03), and (0.77±0.04), and the differences were also not statistically significant. The CT number of the liver in the three-phase VNC image was higher than that in the TNC image. The CNR of the three-phase VNC image and the SNR of the VNCv image were not statistically different from those of the TNC image, and the liver CT numbers, SNRs, and CNRs in the three-phase VNC and TNC images were highly consistent. Using the VNC+three-phase enhancement scheme can reduce the radiation dose by approximately 29.63% by removing the TNC part. Conclusion: The VNC DECT image of the liver is of good quality and can accurately reproduce the TNC image, meeting clinical diagnostic needs.
-
间质性肺异常(interstitial lung anomaly,ILA)是在轻度症状或轻微肺功能损害患者中偶然发现的,提示早期间质性肺疾病(interstitial lung disease,ILD)[1]。Fleischner协会提出,ILA是在无疑似ILD患者中发现与ILD相符的特异性CT表现,并建议对其进行评估[2]。研究表明,ILA很常见[3],且与死亡率增加、肺癌风险和癌症治疗相关并发症显著相关[4-5]。Cedars-Sinai等[6]通过对类风湿关节炎(rheumatoid arthritis,RA)患者进行纵向随访,发现基线时存在ILA的患者1年后出现影像学进展。因此,有必要对ILA进行早期诊断和适当管理。
ILD是结缔组织病(connective tissue disease,CTD)最常见的肺部并发症[7],通常与不良结局和早期死亡率有关[8]。结缔组织疾病相关间质性肺疾病(connective tissue disease-associated interstitial lung disease,CTD-ILD)常表现为咳嗽等非特异性症状[9],通常在病程晚期被诊断[10],且与其他疾病重叠,导致ILD诊断常被延迟和低估[11],使患者预后恶化[12]。而抗纤维化治疗已被证明可降低ILD患者的死亡率和急性加重的风险[13],延缓肺纤维化进展[14]。因此,保持对ILD的高度怀疑,并尽早识别和治疗有助于改善患者的临床结局[15-16]。
目前,高分辨率计算机断层扫描(high-resolution CT,HRCT)是诊断ILD的金标准[17],也是筛查ILA的重要工具[2]。然而,肉眼识别肺区5%异常具有挑战性[18],且早期ILA影像表现与其他肺部病变(如重力依赖型肺不张、局灶胸椎旁纤维化等[19])相似。而定量CT可克服这些局限性,在ILA评估中发挥着重要作用[20]。该技术不仅能量化不同影像表现(如磨玻璃影、纤维化等)的占比,还能评估肺部整体损伤(如平均肺密度等)情况,并能早期发现病变,为疾病评估和早期诊断提供重要依据。
然而,目前针对CTD患者的ILA的研究仍较少。本研究纳入CTD-ILA及CTD-ILD患者,通过定量CT评估患者肺损伤情况,探讨定量CT指标对于CTD-ILA、CTD-ILD的预测作用及诊断效能,建立基于定量CT的CTD患者筛查方法,为早期诊断与个性化管理提供参考依据。
1. 资料与方法
1.1 一般资料
选取延安大学附属医院2018年1月至2024年11月CTD-ILA患者33例、CTD-ILD患者140例,对照组109例。
CTD-ILA/ILD纳入标准:类风湿关节炎(RA)、系统性硬化症(systemic sclerosis,SSc)、皮肌炎(dermatomyositis,DM)、系统性红斑狼疮(systemic lupus erythematosus,SLE)、抗中性粒细胞胞浆抗体(anti-neutrophil cytoplasmic antibody,ANCA)相关血管炎的诊断分别符合2010年[21]、2013年[22]、2017年[23]、2019年[24]、2022年[25]美国风湿病学会指南,干燥综合征(sjögren’s syndrome,SS)、弥漫性结缔组织病(mixed connective tissue disease,MCTD)诊断符合2016年[26]、2019年[27]美欧共识小组指南,ILA的定义符合2020年Fleischner协会指南[2],ILD的定义符合2013年英国胸科协会指南[28]。ILA和ILD示例图如图1所示。
![]() 图 1 CTD-ILA(a)和CTD-ILD(b)HRCT示例图注:(a)一名59岁系统性红斑狼疮女性患者,按照指南诊断ILA,患者尚无呼吸系统症状。(b)一名66岁类风湿关节炎男性患者,按照指南诊断ILD,患者存在呼吸系统症状。Figure 1. Representative HRCT images of CTD-ILA (a) and CTD-ILD (b)
图 1 CTD-ILA(a)和CTD-ILD(b)HRCT示例图注:(a)一名59岁系统性红斑狼疮女性患者,按照指南诊断ILA,患者尚无呼吸系统症状。(b)一名66岁类风湿关节炎男性患者,按照指南诊断ILD,患者存在呼吸系统症状。Figure 1. Representative HRCT images of CTD-ILA (a) and CTD-ILD (b)CTD-ILA/ILD排除标准:无薄层高分辨率CT;胸部CT存在伪影;3D slicer无法分割;存在胸部肿瘤、感染[29-30]、肺气肿、胸腔积液;胸部手术史。对照组的纳入标准:符合CTD诊断但未患ILD的人群,其排除标准与CTD-ILD/ILD患者排除标准一致。
1.2 HRCT检查及定量分析
使用128层螺旋CT扫描仪(上海联影UCT-760)进行检查,受试者取仰卧位,于深吸气末扫描,扫描范围为肺尖至肺底膈面。扫描参数:管电压120 kV、管电流自动调节,扫描层厚5 mm,使用1 mm标准算法重建。
由两名经验丰富的放射科主任医生判断患者胸部CT质量并对其进行影像分型。定量CT指标使用3D-Slicer(5.6.2版本,http://www.slicer.org)获得。使用密度直方图和密度阈值法获得定量CT指标。具体步骤如图2所示。
密度阈值法的阈值设置:全肺像素阈值设定为 −
1024 HU至 − 200 HU,进一步细分为正常肺区(− 950 HU至 − 700 HU)、磨玻璃密度区(− 700 HU至 − 500 HU)和纤维化区(− 500 HU至 − 200 HU)。计算这些区域像素与全肺像素比例,得到正常肺区域(normal lung,NL)、磨玻璃密度区域(ground-glass opacity,GGO)和纤维化区域(fibrosis,F)百分比,以及异常病变区域(abnormal area,AA)的百分比(AA%为GGO%与F%之和),定量分割结果如图3所示。![]() 图 3 密度阈值分割法示例图注:(a)为CT横断位图,(b)为定量CT分割结果图。蓝色代表正常肺组织的百分比(NL%),橙色表示磨玻璃样混浊区域的百分比(GGO%),粉红色表示纤维化区域的百分比(F%),红色表示血管。磨玻璃样混浊区和纤维化区的百分比之和被设置为异常病变区的百分比(AA%)。Figure 3. Schematic illustration of density threshold segmentation methodology
图 3 密度阈值分割法示例图注:(a)为CT横断位图,(b)为定量CT分割结果图。蓝色代表正常肺组织的百分比(NL%),橙色表示磨玻璃样混浊区域的百分比(GGO%),粉红色表示纤维化区域的百分比(F%),红色表示血管。磨玻璃样混浊区和纤维化区的百分比之和被设置为异常病变区的百分比(AA%)。Figure 3. Schematic illustration of density threshold segmentation methodology密度直方图法通过统计不同密度值出现的频率生成灰度直方图,得到高衰减区(high attenuation area,HAA)、平均肺密度(mean lung density,MLD)、标准差(standard deviation,SD)、峰度(Kurtosis)和偏度(Skewness)参数。
1.3 统计学方法
采用Shapiro-Wilk W进行正态检验。正态资料以(均数±标准差)表示,非正态资料以中位数(四分位数间距)表示,分类变量以频率(百分比(%))表示。组间差异用单因素方差分析或Kruskal-Wallis H检验分析,采用Bonferroni法进行事后比较。
应用受试者操作特征曲线(receiver operator characteristic curve,ROC)评估肺定量CT指标在区分对照组与CTD-ILA、对照组与CTD-ILD、CTD-ILA与CTD-ILD的诊断效能,使用多元逐步Logistic回归筛选预测CTD-ILA及CTD-ILD的定量CT指标。
使用SPSS 25.0进行统计分析,以P<0.05为差异具有统计学意义。
2. 结果
2.1 患者基线特征
本研究共纳入282名患者,包括对照组109例,CTD-ILD组140例,CTD-ILA组33例。3组患者在性别、年龄和CTD类型方面存在差异,而病程、BMI以及CT分型方面无显著差异(表1)。
表 1 患者临床资料表Table 1. Demographic and clinical characteristics of study participants项目 组别 统计检验 对照组(n=109) CTD-ILA(n=33) CTD-ILD(n=140) F/H P 性别(%) 14.52 0.001 男 19(17.3) 14(42.4) 53(37.9) 女 90(81.8) 19(57.6) 87(62.1) 年龄/岁 40(19) 64(11) 62.5(14) 104.52 <0.001 BMI/(kg/m2) 22.54(2.81) 21.89(3.08) 22.34(4.39) 0.29 0.864 病程 3(7) 5(11.25) 4(10.75) 3.25 0.187 CTD类型(%) 9.66 0.008 类风湿关节炎 63(57.3) 22(66.7) 67(47.9) 系统性红斑狼疮 24(21.8) 5(15.2) 10(7.1) 系统性硬化症 2(1.8) 2(6.1) 15(10.7) 干燥综合症 9(8.2) 2(6.1) 16(11.4) 皮肌炎 − 2(6.1) 8(5.7) 弥漫性结缔组织病 7(6.4) − 15(10.7) ANCA相关血管炎 4(3.6) 2(6.1) 9(6.4) CT分型(%) 1.12 0.291 普通型间质性肺炎 − 7(21.2) 41(29.3) 非特异性间质性肺炎 − 18(54.5) 71(50.7) 淋巴细胞性间质性肺炎 − 4(12.1) 22(15.7) 机化性肺炎 − 4(12.1) 6(4.3) 2.2 各组间定量指标差异
定量CT指标分析显示(表2),组间定量CT指标均存在统计学差异(P<0.05)。在密度阈值法中,从无ILD、ILA到ILD,NL%逐渐下降,而GGO%、F%、AA% 则逐渐上升。
表 2 各组间定量CT指标差异Table 2. Intergroup differences in quantitative CT metrics among controls, CTD-ILA, and CTD-ILD cohorts项目 组别 统计检验 对照组(n=109) CTD-ILA(n=33) CTD-ILD(n=140) F/H P NL% 74(7) 68.0(7.5)* 65.5(9)* 89.82 <0.001 GGO% 5.7(3.7) 11.3(8.75)* 12.65(9.1)* 76.00 <0.001 F% 2.9(1.25) 5.2(3.4)* 6.6(4.98)* 113.72 <0.001 AA% 8.8(4.9) 16.40(11.80)* 19.35(12.67)* 89.51 <0.001 HAA 4.04(2.18) 9.25±5.26* 9.44(6.92)* 114.05 <0.001 MLD −830.16(49.19) −777.08(59.02)* −768.19(93.69)* 70.18 <0.001 SD 179.94(16.38) 205.52(25.83)* 220.19(41.43)* 139.60 <0.001 Kurtosis 13.62±4.20 6.77(4.91)* 5.28(5.64)* 122.59 <0.001 Skewness 3.27(0.71) 2.34(0.74)* 2.19±0.60* 115.41 <0.001 注:*表示与对照组相比P<0.05。NL%为正常肺区域百分比;GGO%为磨玻璃密度区域百分比;F%为纤维化区域百分比;AA%为异常病变区域百分比;HAA为高衰减区;MLD为平均肺密度;SD为标准差;Kurtosis为峰值;Skewness为偏度。 密度直方图法中,MLD、HAA、SD呈上升趋势,而Kurtosis和Skewness则逐渐减小。
2.3 定量CT指标区分ILA与ILD ROC曲线
ROC曲线分析结果显示,SD、HAA、Kurtosis和F%在区分对照组与CTD-ILA(表3和图4)、对照组与CTD-ILD(表4和图5)方面表现优异。其中,SD的曲线下面积(AUC)最大,在区分对照组与CTD-ILA(AUC=0.862)和对照组与CTD-ILD(AUC=0.923)时均表现出较高的诊断效能。在密度阈值法中,F%区分两者AUC值最大。
表 3 定量CT指标区分对照组与CTD-ILA的ROC曲线分析结果Table 3. ROC curve analysis of quantitative CT metrics for discriminating control groups from CTD-ILA patients项目 AUC P 最佳截断值 灵敏度 特异度 约登指数 NL% 0.770 <0.001 < 71.50 0.758 0.743 0.501 GGO% 0.774 <0.001 > 8.000 0.788 0.734 0.522 F% 0.814 <0.001 > 4.050 0.758 0.807 0.565 AA% 0.785 <0.001 > 12.20 0.788 0.762 0.549 HAA 0.830 <0.001 > 6.121 0.788 0.835 0.623 MLD 0.763 <0.001 > −800.9 0.697 0.798 0.495 SD 0.862 <0.001 > 191.2 0.849 0.817 0.665 Kurtosis 0.821 <0.001 < 9.615 0.727 0.844 0.571 Skewness 0.816 <0.001 < 2.795 0.788 0.817 0.604 注:NL% 为正常肺区域百分比;GGO%为磨玻璃密度区域百分比;F%为纤维化区域百分比;AA%为异常病变区域百分比;HAA为高衰减区;MLD为平均肺密度;SD为标准差; Kurtosis为峰值; Skewness为偏度。 ![]() 图 4 定量CT指标区分对照组与CTD-ILA ROC曲线Figure 4. Receiver operating characteristic (ROC) curves of quantitative CT metrics for discriminating between control group and CTD-ILA patients
图 4 定量CT指标区分对照组与CTD-ILA ROC曲线Figure 4. Receiver operating characteristic (ROC) curves of quantitative CT metrics for discriminating between control group and CTD-ILA patients![]() 图 5 定量CT指标区分对照组与CTD-ILD ROC曲线Figure 5. Receiver operating characteristic (ROC) curves of quantitative CT metrics for differentiating between control group from CTD-ILD patients
图 5 定量CT指标区分对照组与CTD-ILD ROC曲线Figure 5. Receiver operating characteristic (ROC) curves of quantitative CT metrics for differentiating between control group from CTD-ILD patients在区分CTD-ILA与CTD-ILD的ROC曲线分析(表5和图6),SD的诊断价值最佳(AUC=0.649),其次为Kurtosis(AUC=0.638),密度阈值法中F%的AUC最大为0.617。
表 4 定量CT指标区分对照组与CTD-ILD的ROC曲线分析结果Table 4. ROC curve analysis of quantitative CT metrics for differentiating control groups from CTD-ILD patients项目 AUC P 最佳截断值 灵敏度 特异度 约登指数 NL% 0.844 <0.001 < 71.50 0.829 0.743 0.572 GGO% 0.815 < 0.001 > 8.350 0.771 0.752 0.524 F% 0.886 < 0.001 > 4.050 0.727 0.807 0.535 AA% 0.843 < 0.001 > 11.30 0.857 0.716 0.573 HAA 0.885 < 0.001 > 6.205 0.727 0.844 0.571 MLD 0.801 < 0.001 > −798.2 0.636 0.826 0.462 SD 0.923 < 0.001 > 191.2 0.864 0.817 0.680 Kurtosis 0.896 < 0.001 < 11.74 0.818 0.706 0.525 Skewness 0.889 < 0.001 < 2.795 0.727 0.817 0.544 注:NL%为正常肺区域百分比;GGO%为磨玻璃密度区域百分比;F%为纤维化区域百分比;AA%为异常病变区域百分比;HAA为高衰减区;MLD为平均肺密度;SD为标准差; Kurtosis为峰值; Skewness为偏度。 表 5 定量CT指标区分CTD-ILA与CTD-ILD的ROC曲线分析结果Table 5. ROC curve analysis of quantitative CT metrics for differentiating CTD-ILA from CTD-ILD项目 AUC P 最佳截断值 灵敏度 特异度 约登指数 NL% 0.600 0.074 < 63.50 0.379 0.788 0.167 GGO% 0.544 0.435 > 12.10 0.536 0.576 0.112 F% 0.617 0.037 > 5.450 0.650 0.576 0.226 AA% 0.574 0.187 > 16.85 0.600 0.576 0.176 HAA 0.585 0.128 > 10.06 0.486 0.727 0.213 MLD 0.568 0.224 > −758.5 0.429 0.758 0.186 SD 0.649 0.008 > 219.1 0.529 0.758 0.286 Kurtosis 0.638 0.014 < 5.095 0.479 0.849 0.327 Skewness 0.614 0.042 < 1.932 0.364 0.879 0.243 注:NL%为正常肺区域百分比;GGO%为磨玻璃密度区域百分比;F%为纤维化区域百分比;AA%为异常病变区域百分比;HAA为高衰减区;MLD为平均肺密度;SD为标准差; Kurtosis为峰值; Skewness为偏度。 ![]() 图 6 定量CT指标区分CTD-ILA与CTD-ILD ROC曲线Figure 6. Receiver operating characteristic (ROC) curves of quantitative CT metrics for discriminating between CTD-ILA and CTD-ILD
图 6 定量CT指标区分CTD-ILA与CTD-ILD ROC曲线Figure 6. Receiver operating characteristic (ROC) curves of quantitative CT metrics for discriminating between CTD-ILA and CTD-ILD2.4 定量CT指标预测ILA与ILD 多元Logistic回归分析
将NL%、GGO%、F%、AA%、HAA、MLD、SD、Kurtosis、Skewness作为自变量,分组结果(ILA/ILD)为因变量,进行多元逐步logistic回归。
结果显示(表6),在区分对照组与ILD及ILA时,F%(β=0.620,P=0.006,OR=1.895;β=0.854,P=0.000,OR=2.349)、GGO%(β=−0.302,P=0.002,OR=0.739;β=−0.454,P=0.000,OR=0.635)、SD(β=0.026,P=0.009,OR=1.016;β=0.016,P=0.000,OR=1.026)、Kurtosis(β=−0.370,P=0.000,OR=0.691;β=−0.439,P=0.000,OR=0.645)具有统计学差异。
表 6 定量CT指标预测ILA与ILD多因素多元logistic回归结果Table 6. Multivariate logistic regression analysis of quantitative CT metrics in predicting ILA vs. ILD项目 β BE wald P OR 95% CI 下限 上限 ILA F% 0.620 0.225 7.629 0.006 1.859 1.197 2.887 GGO% −0.302 0.098 9.546 0.002 0.739 0.610 0.895 SD 0.015 0.006 6.784 0.009 1.016 1.004 1.027 Kurtosis −0.370 0.069 28.727 0.000 0.691 0.603 0.791 ILD F% 0.854 0.209 16.666 0.000 2.349 1.559 3.540 GGO% −0.454 0.092 24.385 0.000 0.635 0.530 0.760 SD 0.026 0.005 23.855 0.000 1.026 1.016 1.037 Kurtosis −0.439 0.062 50.962 0.000 0.645 0.571 0.727 注:GGO%为磨玻璃密度区域百分比;F%为纤维化区域百分比;SD为标准差; Kurtosis为峰值。 3. 讨论
ILA及ILD均与CTD患者不良预后和早期死亡率密切相关,早期识别和管理对改善患者结局至关重要。但目前临床筛查仍依赖视觉评估,易导致早期病变漏诊。与既往研究相比,本研究系统量化了正常肺组织、到ILA、再到ILD的连续演变规律,为疾病发展提供客观证据;其次,构建基于定量CT的CTD患者筛查方法,为建立风险分层提供依据;最后,使用开源分析软件,免费、省时,有利于技术推广与普及。
从无ILD的CTD对照组、CTD-ILA到CTD-ILD,NL%、峰度(Kurtosis)和偏度(Skewness)逐渐下降,而GGO%、F%、AA%、MLD、HAA以及SD则逐渐上升,与Ahn等[31]及杨凯等[32]的研究一致,表明ILA是ILD的早期阶段。
定量CT指标的ROC曲线和Logistic回归分析表明,F%、GGO%、SD和Kurtosis是区分对照组与CTD-ILA/ILD的敏感指标。在密度阈值法,F%在区分对照组与CTD-ILA(AUC=0.814)和CTD-ILD(AUC=0.886)时表现最佳,提示其在早期诊断ILA和ILD方面具有重要意义。与Zhang等[33]研究结果一致,F%同样被证实为识别健康对照与特发性肺间质纤维化(idiopathic pulmonary fibrosis,IPF)的最佳指标(AUC=0.962)。但本研究F%的AUC值低于其在IPF中的表现,这提示炎症主导的CTD-ILD与纤维化驱动的IPF存在差异[34],表明定量指标筛查应结合患者病因。
此外,磨玻璃密度区域百分比(GGO%)在诊断ILA及ILD方面同样具有重要价值(β1=−0.302,P=0.002,OR=0.739;β2=−0.454,P=0.000,OR=0.635)。这与马震忠等[35]发现皮肌炎/多发性肌炎相关ILD(DM/PM-ILD)患者HRCT表现以磨玻璃影为主(87.2%,123/141)一致,徐光兴等[36]证实GGO%在鉴别DM/PM-ILD与健康对照组时具有较高的诊断效能(AUC=0.91),但DM/PM-ILD患者的影像表现以非特异性间质性肺炎(NSIP)为主[9],而本研究还纳入了约30%以普通型间质性肺炎(usual interstitial pneumonia,UIP)表现为主的患者,这表明GGO%在鉴别不同亚型ILD时具有广泛适用性。
密度直方图法中,标准差(SD)和峰度(Kurtosis)是区分正常组和CTD-ILA/ILD有意义的指标。SD的曲线下面积最大(AUC=0.862,AUC=0.923),Kurtosis区分ILD(AUC=0.896)仅次于SD(AUC=0.923),与Guisado-Vasco等[37]研究一致。研究表明SD还是区分局限性和弥漫性SSc-ILD和SS-ILD的最佳鉴别参数[38-39],进一步证明SD对于判断疾病严重程度也具有重要价值。
而区分ILA与ILD的ROC曲线显示SD的AUC最大(AUC=0.649),SD>219.1为区分ILA和ILD的最佳截断值。在密度阈值法,F%的AUC最大(AUC=0.617),F%>5.450为区分ILA和ILD的最佳截断值。然而,基于定量CT区分ILD和ILA的结果仅供参考,实际应用还需结合患者临床症状、肺功能检查及随访结果进行综合评估。
基于当前证据,我们提出CTD肺部评估的大致路径:初筛阶段采用SD、F%、GGO%、和Kurtosis排除高危人群;对于异常患者采用SD和F%判断患者是否患ILA或ILD。针对ILA患者,定期随访监测病情变化;而ILD患者则评估病情程度,尽早治疗改善预后。
尽管高衰减区(HAA)未被纳入回归模型,但其在区分对照组与ILA患者时表现较好(AUC=0.830)。既往研究也表明,HAA在无症状类风湿关节炎(RA)识别ILD风险的能力最强[40],不同肺区域HAA与肺重塑的生物标志物、ILA的风险和全因死亡率相关[41],呼气HAA被认为是所有直方图分析指标中ILD严重程度的最佳预测因子[42],均提示HAA对于早期诊断的价值。此外,Shiraishi等[43]纵向评估COPD患者ILA,发现ILDvol%(磨玻璃影、网状影和蜂窝影的体积之和)与ILA 的发生相关,是识别和监测COPD患者ILA的可重复方法。这与我们的AA%指标类似,但AA%区分对照组与CTD-ILA/ILD AUC值较小,可能是3D slicer无法区分蜂窝影与肺气肿的局限性,未来需通过深度学习算法优化分割精度。
本研究的局限性。①样本量较小,尤其是CTD-ILA组。由于前期研究重点是CTD-ILD,对ILA人群关注较少,但本研究仍为该领域提供了有价值的依据,未来将增加样本量,优化研究结果。②基线资料年龄和性别存在差异,但将其纳入回归分析后模型参数并未显著优化,因此未将其纳入最终分析。③3D slicer目前无法区分肺气肿与蜂窝影,因此纳入人群时已排除合并肺气肿的患者,可能存在一定的选择偏移。④研究主要聚焦于定量CT诊断价值,忽略了血清学指标、肺功能等的诊断意义,后续研究将纳入临床指标进行分析。
综上所述,本研究不仅验证了定量CT在CTD-ILD/ILA早期诊断中的价值,还提出基于定量CT的CTD患者筛查方式,为患者精准管理提供有力支持。未来需在大样本中验证其适用性,并探索其与临床指标的协同作用。
-
![]()
图 1 采用PSNR和SSIM方法评价TNC和VNC图像质量示意图
注:PSNR值大于30 dB代表图像质量良好;SSIM值的范围为0至1,越大代表图像越相似。
Figure 1. Schematic representation of the evaluation of TNC and VNC image quality using PSNR and SSIM methods
![]()
图 2 Bland-Altman散点图评估Ⅲ期VNC与TNC图像的CT值、SNR及CNR一致性
Figure 2. Bland-Altman scatter plots of the consistency of CT numbers, SNRs, and CNRs between three-phase VNC and TNC images
![]()
图 3 TNC+Ⅲ期增强扫描与VNC+Ⅲ期增强扫描的DLP配对连线图
Figure 3. Paired-line plots of DLP values between the TNC+three-phase enhanced scan and VNC+three-phase enhanced scan
表 1 Ⅲ期VNC与TNC图像PSNR与SSIM的比较(
$\bar x \pm s $ )Table 1 Comparison of PSNR and SSIM values between three-phase VNC and TNC images
$(\bar x \pm s )$ 项目 整体评价 局部评价 PSNR/dB SSIM PSNR/dB SSIM VNCa 18.01±1.06 0.76±0.04 29.90±2.50 0.75±0.04 VNCv 18.33±0.99 0.77±0.03 30.97±2.34 0.77±0.03 VNCd 18.20±1.04 0.78±0.04 30.61±2.76 0.77±0.04 H 1.464 3.837 3.204 4.868 P 0.481 0.147 0.201 0.088  下载: 导出CSV
表 2 Ⅲ期VNC与TNC图像CT值、SNR及CNR的比较
$ \left(\bar{x}\pm s\right) $ Table 2 Comparison of CT numbers, SNRs, and CNRs between three-phase VNC and TNC images
$ \left(\bar{x}\pm s\right) $ 项目 TNC VNCa VNCv VNCd at bt ct aP bP cP CT值/HU 59.79±7.56 61.96±7.85a 63.24±8.89b 61.38±9.06c −4.119 −4.852 −2.315 <0.010 <0.010 0.027 SNR 5.31±1.07 4.95±0.80 a 5.14±0.94 b 4.92±1.04 c 3.163 1.464 3.247 0.003 0.153 0.003 CNR 0.74±0.92 0.71±0.83a 0.82±0.87b 0.64±0.92c 0.391 −1.314 1.434 0.698 0.198 0.161 注:a表示VNCa与TNC比较;b表示VNCv与TNC比较;c表示VNCd与TNC比较。
下载: 导出CSV
-
[1] 杨志安, 闵小红, 徐俏宇, 等. 能谱CT虚拟平扫及水基图定量参数在诊断颅脑血管内治疗术后颅内出血的研究[J]. 临床放射学杂志, 2024, 43(6): 872-877. DOI: 10.13437/j.cnki.jcr.2024.06.004. YANG Z A, MIN X H, XU Q Y, et al. The value of quantitative parameters on virtual non-contrast and water-based images of brain spectral CT in early diagnosing intracranial hemorrhage after endovascular treatment[J]. Journal of Clinical Radiology, 2024, 43(6): 872-877. DOI: 10.13437/j.cnki.jcr.2024.06.004. (in Chinese).
[2] 尹娇, 魏茜, 彭超, 等. 双层探测器光谱CT虚拟平扫联合40keV虚拟单能量成像用于降低小肠CT造影辐射剂量[J]. 中国医学影像技术, 2023, 39(12): 1883-1887. DOI: 10.13929/j.issn.1003-3289.2023.12.032. YIN J, WEI Q, PENG C, et al. Virtual non-contrast images combined with 40 keV virtual monoenergetic images for reducing radiation dose of CT enterography based on dual-layer spectral detector CT[J]. Chinese Journal of Medical Imaging Technology, 2023, 39(12): 1883-1887. DOI: 10.13929/j.issn.1003-3289.2023.12.032. (in Chinese).
[3] CHEN M, DING L, DENG S, et al. Differentiating the invasiveness of lung adenocarcinoma manifesting as ground glass nodules: Combination of dual-energy CT parameters and quantitative-semantic features[J]. Academic Radiology, 2024, 31(7): 2962-2972. DOI: 10.1016/j.acra.2024.02.011.
[4] CATANIA R, JIA L, HAGHSHOMAR M, et al. Detection of moderate hepatic steatosis on contrast-enhanced dual-source dual-energy CT: Role and accuracy of virtual non-contrast CT[J]. European Journal of Radiology, 2024, 172: 111328. DOI: 10.1016/j.ejrad.2024.111328.
[5] RAJIAH P, PARAKH A, KAY F, et al. Update on multienergy CT: Physics, principles, and applications[J]. Radiographics, 2020, 40(5): 1284-1308. DOI: 10.1148/rg.2020200038.
[6] BORHANI A A, KULZER M, IRANPOUR N, et al. Comparison of true unenhanced and virtual unenhanced (VUE) attenuation values in abdominopelvic single-source rapid kilovoltage-switching spectral CT[J]. Abdominal Radiology (NY), 2017, 42(3): 710-717. DOI: 10.1007/s00261-016-0991-5.
[7] 孙嘉晨, 景梦园, 刘宏, 等. 能谱CT虚拟平扫技术在化疗相关性脂肪肝中的应用[J]. 中国医学影像学杂志, 2023, 31(5): 509-514. DOI: 10.3969/j.issn.1005-5185.2023.05.015. SUN J C, JING M Y, LIU H, et al. Application of energy spectrum CT virtual non-contrast technology in chemotherapy-related fatty liver[J]. Chinese Journal of Medical Imaging, 2023, 31(5): 509-514. DOI: 10.3969/j.issn.1005-5185.2023.05.015. (in Chinese).
[8] SCHMIDT B, FLOHR T. Principles and applications of dual source CT[J]. Physica Medica, 2020, 79: 36-46. DOI: 10.1016/j.ejmp.2020.10.014.
[9] KRAUSS B, GRANT K L, SCHMIDT B T, et al. The importance of spectral separation: An assessment of dual-energy spectral separation for quantitative ability and dose efficiency[J]. Investigative Radiology, 2015, 50(2): 114-118. DOI: 10.1097/RLI.0000000000000109.
[10] LIANG H, DU S, YAN G, et al. Dual-energy CT of the pancreas: comparison between virtual non-contrast images and true non-contrast images in the detection of pancreatic lesion[J]. Abdominal Radiology, 2023, 48(8): 2596-2603. DOI: 10.1007/s00261-023-03914-0.
[11] VOO K H B, BONG D B L. Quality assessment of stereoscopic image by 3D structural similarity[J]. Multimedia Tools and Applications, 2018, 77(2): 1-20. DOI: 10.1007/s11042-017-4361-2.
[12] SHI B, LIU K. Regularization by multiple dual frames for compressed sensing magnetic resonance imaging with convergence analysis[J]. IEEE/CAA Journal of Automatica Sinica, 2023, 10(11): 2136-2153. DOI: 10.1109/JAS.2023.123543.
[13] ZHAO B , LIU Z , DING S , et al. Motion artifact correction for MR images based on convolutional neural network[J]. Optoelectronics Letters, 2022, 18(1): 54-58. DOI: 10.1007/s11801-022-1084-z.
[14] WANG Z, BOVIK A C, SHEIKH H R, et al. Image quality assessment: from error visibility to structural similarity[J]. IEEE Trans Image Process, 2004, 13(4): 600-612. DOI: 10.1109/TIP.2003.819861.
[15] FAN M, CAO X, LÜ F, et al. Generative adversarial network-based synthesis of contrast-enhanced MR images from precontrast images for predicting histological characteristics in breast cancer[J]. Physics in Medicine & Biology, 2024, 69(9). DOI: 10.1088/1361-6560/ad3889.
[16] EIDEX Z, WANG J, SAFARI M, et al. High-resolution 3T to 7T ADC map synthesis with a hybrid CNN-transformer model[J]. Medical Physics, 2024, 51(6): 4380-4388. DOI: 10.1002/mp.17079.
[17] SHEIKH H R, SABIR M F, BOVIK A C. A statistical evaluation of recent full reference image quality assessment algorithms[J]. EEE Transactions on Image Processing, 2006, 15(11): 3440-3451. DOI: 10.1109/tip.2006.881959.
[18] HAJI-MOMENIAN S, PARKINSON W, KHATI N, et al. Singleenergy non-contrast hepatic steatosis criteria applied to virtual non-contrast images: Is it still highly specific and positively predictive?[J]. Clinical Radiology, 2018, 73(6): 594. e7-594. e15. DOI: 10.1016/j.crad.2018.01.018.
[19] de CECCO C N, DARNELL A, MACÍAS N, et al. Virtual unenhanced images of the abdomen with second-generation dual-source dual-energy computed tomography: Image quality and liver lesion detection[J]. Investigative Radiology, 2013, 48(1): 1-9. DOI: 10.1097/RLI.0b013e31826e7902.
[20] ZHANG L J, PENG J, WU S Y, et al. Liver virtual non-enhanced CT with dual-source, dual-energy CT: A preliminary study[J]. European Radiology, 2010, 20(9): 2257-2264. DOI: 10.1007/s00330-010-1778-7.
[21] ZHOU J, ZHOU Y, HU H, et al. Feasibility study of using virtual non-contrast images derived from dual-energy CT to replace true non-contrast images in patients diagnosed with papillary thyroid carcinoma[J]. Journal of X-ray Science and Technology, 2021, 29(4): 711-720. DOI: 10.3233/XST-210884.
[22] 顾芳燕, 朱晓梅, 聂芳, 等. 肝脏占位病变能谱CT成像中不同期相虚拟平扫替代真实平扫的效能及方案选择[J]. 中国医学影像学杂志, 2024, 32(8): 809-815. DOI: 10.3969/j.issn.1005-5185.2024.08.010. GU F Y, ZHU X Y, NIE F, et al. Feasibility and protocol selection of virtual non-contrast technology replacing true non-contrast scanning in tri-phase of liver lesions with spectral CT[J]. Chinese Journal of Medical Imaging, 2024, 32(8): 809-815. DOI: 10.3969/j.issn.1005-5185.2024.08.010. (in Chinese).
[23] LACROIX M, MULÉ S, HERIN E, et al. Virtual unenhanced imaging of the liver derived from 160-mm rapid-switching dual-energy CT (rsDECT): Comparison of the accuracy of attenuation values and solid liver lesion conspicuity with native unenhanced images[J]. Chinese Journal of Medical Imaging, 2020, 133: 109387. DOI: 10.1016/j.ejrad.2020.109387.
[24] 林禹, 张潇潇, 张有彬, 等. 双层探测器光谱CT虚拟平扫应用于肝脏Ⅲ期增强扫描[J]. 中国医学影像技术, 2020, 36(S1): 29-33. DOI: 10.13929/j.issn.1003-3289.2020.z1.007. LIN Y, ZHANG X X, ZHANG Y B, et al. Application of dual-layer spectral detector CT virtual non-contrast images in hepatic triple-phase enhanced scan[J]. Chinese Journal of Medical Imaging Technology, 2020, 36(S1): 29-33. DOI: 10.13929/j.issn.1003-3289.2020.z1.007. (in Chinese).


计量
- 文章访问数: 176
- HTML全文浏览量: 40
- PDF下载量: 41
