
Quantitative CT Assessment of Pulmonary Fibrosis Severity in Patients with Connective Tissue Disease-associated Interstitial Lung Disease
-
摘要:
目的:结合视觉评分及定量CT指标对患者肺纤维化严重程度进行风险分层。方法:纳入96例结缔组织疾病相关间质性肺病(CTD-ILD)患者和47例无间质性肺疾病(ILD)的结缔组织病(CTD)对照组,采用Warrick评分和3D Slicer密度直方图法评估肺纤维化程度。结果:标准差(SD)、峰度(Kurtosis)、偏度(Skewness)在不同严重程度组间存在显著差异。多因素逻辑回归显示,高衰减区(HAA%)是患者肺纤维化程度的独立预测指标。受试者操作特征曲线(ROC)表明,联合所有定量CT参数区分正常轻度与中重度患者曲线下面积(AUC)为0.846(灵敏度0.739,特异度0.885)。相关性分析显示,Perc10、Perc15、MLA与RV/TLC存在较弱的正相关。结论:该方法可无创、客观评估CTD-ILD严重程度,为肺功能检测受限患者提供有效替代方案,降低诊疗成本,适合基层推广。
-
关键词:
- 结缔组织病 /
- 间质性肺疾病 /
- Warrick评分 /
- 定量CT指标 /
- 肺间质纤维化严重程度
Abstract:Objective: To classify pulmonary fibrosis severity in connective tissue disease-associated interstitial lung disease (CTD-ILD) patients by integrating visual scoring and quantitative computed tomography (CT). Methods: A total of 96 patients with CTD-ILD and 47 CTD controls without ILD were enrolled. Pulmonary fibrosis was evaluated using the Warrick score and the 3D slicer-based density histogram method. Results: Significant differences were observed in standard deviation (SD), kurtosis, and skewness across the severity groups. Multivariate logistic regression analysis identified HAA as an independent predictor of fibrosis severity. The receiver-operating characterisric curve (ROC) showed that combining all quantitative CT parameters achieved an area under the curve (AUC) of 0.846 (sensitivity=0.739 and specificity=0.885) to distinguish normal/mild cases from moderate/severe cases. Weak positive correlations were observed between Perc10, Perc15, MLA, and RV/TLC. Conclusion: This approach enables a noninvasive and objective assessment of CTD-ILD severity, thereby providing a clinically valuable alternative for patients with limitations in pulmonary function testing, reducing diagnostic and therapeutic costs, and demonstrating a strong potential for widespread implementation in primary healthcare settings.
-
坏死性筋膜炎(necrotizing fasciitis,NF)是危及生命的侵袭性软组织感染,其坏死区域主要累及筋膜及肌肉。这是一种罕见的疾病,常好发于躯干、会阴及四肢,而对于颈部坏死性筋膜炎(cervical necrotizing fasciitis,CNF)来说,由于发病部位的血供丰富,因此其发病率更低,仅占NF的1%~10%[1]。牙源性以及扁桃体感染是常见的发病原因,颌下以及咽旁间隙是最好发的感染部位,发生于鼻咽部较为罕见。
CNF如果不及时诊断以及治疗,病变区域有可能沿着颈深区域向纵隔蔓延,从而导致严重的后果。不受控制的高血糖会导致患者的免疫系统随着年龄的增长越来越虚弱,这往往是该疾病的主要诱发因素[2]。由于CNF在发病初期并无特异性的体征以及实验室指标的异常,因此影像学检查,尤其是CT检查在该病的精准诊断中显得尤为重要。
1. 病史资料
1.1 临床资料
患者男性,58岁,1年余前无明显诱因出现左侧头痛,伴有左耳流脓,无鼻塞、流涕、涕中带血,无耳痛、耳内流血等不适。于当地医院诊断为“慢性化脓性中耳炎”,予以抗炎治疗后头痛稍有减轻。此后患者上述症状持续存在,均予以抗炎治疗,但头痛并未缓解。
10月前患者自觉上述症状加重,并出现左侧面瘫及吞咽困难,之后对症治疗后均未见好转。既往双侧慢性化脓性中耳炎50余年;糖尿病史5年,合并糖尿病性视网膜病史,平时胰岛素控制;高血压病史4年。
1.2 实验室检查
血常规:红细胞3.70×10¹²/L(下降),血红蛋白108 g/L(上升),红细胞压积32.6%(下降),淋巴细胞15.9%(下降),其余正常。血生化:谷丙转氨酶6.3 U/L(下降),谷草转氨酶10.6 U/L(下降),总胆汁酸6.8 umol/L(上升),总蛋白61.3 g/L(下降),白蛋白33.6 g/L(下降),肌酐101 umol/L(上升),葡萄糖4.39 mmol/L,糖化血红蛋白21.9%(上升),其余正常。肿瘤指标:AFP、CEA、CA199、CA125、CA724、PSA、fPSA、fPSA/PSA、CTFRA21-1、SCC、CA50均阴性。
1.3 影像学表现
CT图像显示鼻咽腔基本对称,双侧咽隐窝略变浅(图1);两侧咽旁间隙及咽后间隙软组织肿胀,颅底斜坡骨质破坏,蓝色箭头处可见无强化的筋膜征象(图1(d))。
MRI图像示鼻咽腔基本对称,双侧咽隐窝略变浅(图2);两侧咽旁间隙及咽后间隙软组织肿胀,肌间脂肪消失,增强后咽旁间隙可见散乱不均匀的异常强化,病变沿肌间隙走行,鼻咽粘膜未见异常增厚。蓝色箭头见颅骨斜坡右侧及左下可见稍长T1稍短T2信号影,增强后强化不均匀,周围见强化的软组织信号影(图2(e)和图2(f)),两侧乳突气房可见液性信号影。
PET/CT图像显示FDG异常代谢区域位于鼻咽深部软组织伴邻近颅底斜坡骨质破坏(图3),鼻咽粘膜未见异常代谢(图3(a)~图3(f));头颈部PET图像显示颈部未见肿大淋巴结影(图3(g))。CT、MRI以及PET/CT检查,均误诊为鼻咽癌。
1.4 诊疗过程
患者行鼻内镜下鼻咽部肿物活检术,于鼻咽部可见包裹性脓腔及坏死组织,取部分病理组织送病理及脓性分泌物送细菌培养,广泛彻底清除病灶至正常黏膜。
病理诊断:局部见炎性渗出,局部纤维结缔组织增生及粘液变性,胶原变性。
1.5 随访
患者出院1月后门诊复查,疼痛及吞咽困难的症状缓解,面瘫有所好转。半年后电话跟踪随访,患者疼痛及吞咽困难的症状消失,面瘫基本缓解,仅左眼睑闭合不佳。
2. 讨论
2.1 病因及发病机制
NF是一种组织坏死并且进展迅速的疾病,病原体入侵软组织并且引起血管血栓,最终导致脂肪组织、筋膜及皮肤坏死[3]。CNF更是一种罕见的累及颈部筋膜的微生物感染,它的易感因素包括糖尿病、不良的口腔卫生、酗酒、肿瘤以及静脉吸毒[4]。
CNF最常见原因是牙源性感染(27.5%),其次是扁桃体疾病(22.5%)、皮肤感染(8.75%)和腮腺感染(6.25%)[5]。最常见的并发症是气道阻塞以及下行性坏死性纵隔炎[6]。纵隔炎的预后非常差,因此它与感染性休克一样都是CNF最为严重的并发症[7-8]。
2.2 临床特征
由于CNF预后不良,及时诊断并且早期干预就显得尤为重要。压痛、发热和皮肤红斑是早期NF的常见体征[9]。回顾本病例,可能是由于发病位置的特殊(鼻咽部),患者并无上诉症状,而是表现为左侧头痛伴左耳流脓。
Wong等[10]为了对包括CNF在内的NF进行早期诊断,提出了坏死性感染实验室风险指标(LRINEC)评分。LRINEC评分是以6项实验室指标的异常进行评分,其中包括血清C反应蛋白(>150 mg/L)、白细胞(WBC)计数(>15000/μL)、血红蛋白(<13.5 g/dL)、血清钠水平(<135 mmol/L)、血清肌酐水平(142 mmol/L)和血清葡萄糖水平(10 mmol/L)。LRINEC评分大于等于8分,发生NSTI的风险为75%。虽然之后一些研究对LRINEC评分进行评估,证实了该评分在NF感染初期诊断中的有效性,但是近期的一些研究又发现该指标的敏感性较差,并不能作为排除NF的有效手段[11,12-13]。通过回顾本例患者的实验室指标也验证了这一结论,患者的LRINEC评分仅为2分,远没有达到诊断NF的水平。
2.3 影像学表现
对于临床体征及实验室指标均不明确的早期NF患者,影像学检查可以发挥重要作用。如怀疑为NF,CT扫描是一个有价值的影像学工具。一项关于坏死性筋膜炎的CT研究发现,CT的敏感性达到了100%,特异性为98%,因此CT阴性结果可以有效的排除坏死性筋膜炎,CT阳性结果对诊断坏死性筋膜炎具有很高的价值[14]。当CT图像中出现脂肪受累、沿着筋膜平面走行的液体以及气体聚集,尤其是增强图像出现无强化的筋膜增厚等征象,需要考虑NF[14]。
而MR则被认为是诊断NF最佳的影像学检查,当T2加权像上出现深筋膜增厚>3 mm并伴有多个肌筋膜室受累,此为诊断NF的重要征象[15]。虽然MRI的表现优于CT,但是MRI在某些紧急情况下难以进行,因此不建议将其作为首选的影像学检查技术[11]。我们回顾该患者CT及MRI图像,图像中虽然出现两侧咽旁间隙及咽后间隙肿胀,伴双侧欠对称,咽隐窝变浅,合并颅底骨破坏等表现,这些都是与鼻咽癌相同的征象,但是图像中另外可见典型的深筋膜增厚的表现,尤其是MR上可见散乱不均匀的异常强化,病变沿肌间隙走行,这些均提示需要与坏死性筋膜炎进行鉴别。
在该患者的PET/CT图像上,虽然鼻咽部肿胀伴有较大范围的FDG代谢增高,同时合并颅底骨的破坏,但是FDG异常代谢的区域主要局限在鼻咽深部区域,粘膜并未见FDG异常代谢,这点从MR中信号正常的鼻咽粘膜中得到了印证(图2(c)和图2(d))。
2.4 治疗及转归
本例患者通过鼻咽肿物活检术发现鼻咽部包裹性浓腔及坏死组织,并且病灶进行广泛彻底地清除,完成对CNF的诊断以及治疗。术后患者症状明显缓解,出院后继续接受头孢曲松抗感染治疗。
2.5 诊断与鉴别诊断
目前NF的诊断主要依赖症状学、实验室指标、影像学以及侵入性诊断。然而早期的NF体征与症状几乎没有特异性,通常难以明确诊断。因此当出现肿胀、发热以及与症状不成比例的剧烈疼痛时,需要高度怀疑NF。既往LRINEC评分曾经作为NF诊断的重要依据,但是该评分诊断的敏感性较低,并不能作为排除NF的有效手段。当NF诊断不明确时,影像学检查可以提供相对有价值的信息。
一项包含23项研究总计纳入5982名患者的META分析评估了体格检查、影像学检查以及LRINEC评分在NF诊断中的准确性[13]。该研究发现影像学检查具有敏感性及特异性,尤其是CT的敏感性为88.5%,特异性为93.3%;而体格检查以及LRINEC评分敏感性较差,均不能应用于排除NF。侵入性诊断——手术探查是诊断NF的金标准,当手指可轻易分离筋膜(手指实验阳性)、组织缺血坏死以及恶臭分泌物,均提示NF的诊断[16]。由于该例患者CNF发生于鼻咽部,需要与以下疾病进行鉴别。
2.5.1 鼻咽癌
鼻咽癌病理类型目前以未分化癌及鳞状细胞癌为主,EB病毒感染与鼻咽癌发病率密切相关。早期鼻咽癌基本无症状,也可能因为咽鼓管阻塞引起一系列症状,其中包括鼻塞、鼻出血、中耳炎、听力下降等。影像学表现:CT及MR表现基本相似,表现为鼻咽部两侧欠对称,局部见软组织肿块突入鼻腔内,咽隐窝变浅或消失;当咽旁间隙受累时,其脂肪间隙消失,再向外可累及翼腭窝及颞下窝,向后可累及颅底;增强扫描多表现为不均匀强化。PET/CT表现为FDG高代谢。
2.5.2 鼻咽淋巴瘤
鼻咽淋巴瘤是仅次于鼻咽癌第2常见的鼻咽部恶性肿瘤,它的发病率与EB病毒感染也密切相关。影像学表现,它好发于鼻咽顶壁咽扁桃体和咽鼓管扁桃体附近粘膜内聚集的淋巴小结,往往表现为一种弥漫对称分布的肿块[17]。同时它通常沿着粘膜或脂肪间隙扩散至口咽部及下咽扁桃体,极少累及深层结构,因此鼻咽淋巴瘤很少累及颅底。增强扫描多为均匀性的强化表现,PET/CT也表现为FDG高代谢。
3. 结论
鼻咽部坏死性筋膜炎缺乏早期诊断的特征性表现,但是影像学检查,尤其是CT对该病的早期诊断具有重要价值。
-
![]()
图 1 CTD-ILD HRCT异常表现评分的示例图
注:(a)皮肌炎相关间质性肺疾病患者,女,48岁。黑箭所指为磨玻璃影,计1分;(b)类风湿关节炎相关间质性肺病患者,女,68岁。黑箭所指为胸膜边缘不规则,计2分;(c)类风湿关节炎相关间质性肺疾病患者,男,63岁。黑箭所指为肺间隔索条,计3分;(d)系统性硬化症相关间质性肺疾病患者,女,66岁。黑箭所指为胸膜下索条,计3分;(e)类风湿关节炎相关间质性肺疾病患者,女,71岁。黑箭所指为网格影,计4分;(f)干燥综合征相关间质性肺疾病患者,女,53岁。黑箭所指为胸膜下囊泡,计5分。
Figure 1. Examples of CTD-ILD HRCT abnormality scoring
![]()
图 2 3D-Silcer定量分析示例图
注:(a)~(d)分别为使用3D-Silcer“Lung CT Segmenter”模块进行左右肺分割后的横断位、冠状位、矢状位及三维模式图;(e)为全肺、右肺、左肺密度分布直方图;(f)~(i)分别为全肺、右肺、左肺(从左向右)的高衰减区(HAA%)、第10百分位数(Perc10)、标准差(SD)、偏度(Skewness)分布图。
Figure 2. Examples of 3D-Slicer quantitative analysis
![]()
图 3 定量指标和肺功能相关性热图
注:颜色深浅表示相关性的强度和方向:蓝色代表正相关,红色代表负相关,颜色越深相关性越强。RV/TLC与Perc10、Perc15、MLD之间呈淡蓝色,表现出较弱的正相关。
Figure 3. Heatmap of correlation between quantitative indicators and lung function
![]()
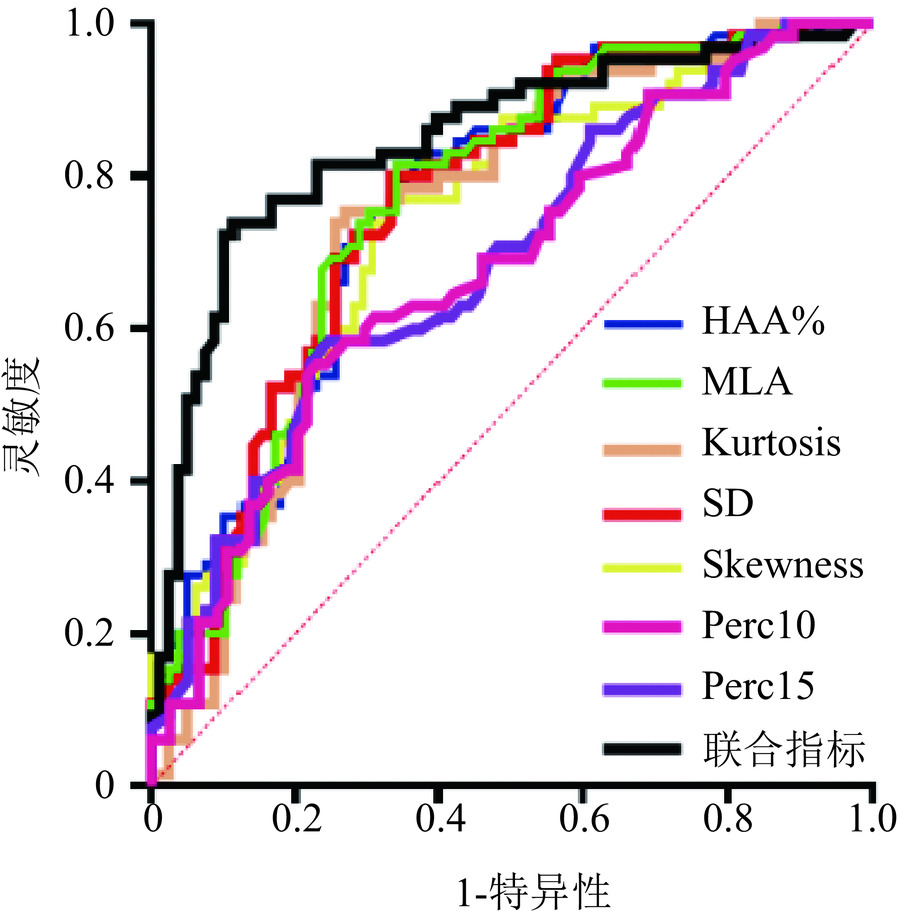
图 4 定量指标区分不同严重程度患者ROC曲线
注:联合指标的AUC最大,为0.846,单个指标中Kurtosis的AUC最大,为0.764。
Figure 4. Quantitative metrics to differentiate ROC curves for patients with different levels of severity
表 1 基线资料表
Table 1 Baseline information table
项目 组别 统计检验 CTD-ILD(n=96) 对照组(n=47) $Z/\chi^2 $ P 性别/(例,%) 男 32(33.3) 8(17) 4.16 0.041 女 64(66.7) 39(83) 年龄/岁 63(14) 44(18) −5.29 < 0.001 BMI/(kg/m2) 22.49(4.58) 22.19(4.49) −0.56 0.571 病程/年 5(11) 5(9) −1.02 0.308 疾病类型/% RA 45(46.9) 34(72.3) 23.37 0.010 SLE 8(8.3) 10(21.3) SSc 14(14.6) − SS 10(10.4) 2(4.3) DM 4(4.2) − MCTD 11(11.5) − ANCA 4(4.2) − 视觉评分/分 总体 9(8) 0(0) −14.50 < 0.001 轻度 7(2) − 中度 12(5) − 重度 18±2 − CT分型/% UIP 31(32.3) − NSIP 46(47.9) − LIP 16(16.7) − OP 3(3.1) − 注:BMI为体重指数;RA为类风湿关节炎;SLE为系统性红斑狼疮;SSc为系统性硬化症:SS为干燥综合症;DM为皮肌炎;MCTD为弥漫性结缔组织病;ANCA为ANCA相关血管炎; UIP为普通型间质性肺炎;NSIP为非特异性间质性肺炎;LIP为淋巴细胞性间质性肺炎;OP为机化性肺炎。  下载: 导出CSV
表 2 基于视觉评分分组的CTD-ILD患者密度直方图法定量指标比较
Table 2 Comparison of quantitative metrics using the density histogram method in CTD-ILD patients grouped by visual scoring
项目 正常(n=47) 轻度(n=41) 中度(n=32) 重度(n=23) F/H P HAA% 4.22(2) 8.11(4.98) * 9.11(6.90) * 10.11(8.84) * 54.48 < 0.001 Perc15 −964(38) −953(43) −961.5(43.5) −966(68) 0.91 0.824 Perc10 −944(40) −932(45.50) −936(43.25) −936(67) 1.78 0.620 MLA −825.7(45.11) −791.43(64.86) * −760.92(83.69) * −755.36(111.11) * 33.66 < 0.001 SD 181.30(19.74) 207.61(27.19) * 230.76(45.53) *# 249.16(53.60)*# 72.84 < 0.001 Kurtosis 13.47(4.97) 7.31(4.93)* 4.09(3.68)*# 3.51(6.43) *# 67.39 < 0.001 Skewness 3.24(0.65) 2.44(0.75) * 1.93(0.69) * 1.84(1.02) *# 62.46 < 0.001 注:*表示与正常组相比,P<0.05;#表示与轻度组相比,P<0.05。HAA为高衰减区; Perc15为全肺像素CT直方图上第15百分位点对应的CT值;Perc10为全肺像素CT直方图上第10百分位点对应的CT值,MLA为平均肺衰减;SD为标准差;kurtosis为峰度,skewness为偏度。
下载: 导出CSV
表 3 定量指标和肺功能相关性
Table 3 Correlation between quantitative indicators and lung function
项目 相关系数及统计检验 HAA% Perc10 Perc15 MLA SD Kurtosis Skewness FVC% r −0.150 −0.158 −0.178 −0.218 −0.261 0.228 0.176 P 0.288 0.263 0.208 0.120 0.062 0.104 0.212 FEV1% r −0.124 −0.136 −0.152 −0.185 −0.221 0.212 0.165 P 0.382 0.337 0.282 0.190 0.116 0.132 0.244 FEV1/ FVC r 0.068 0.131 0.130 0.096 0.051 −0.006 0.006 P 0.633 0.356 0.358 0.498 0.721 0.965 0.966 DLCO% r 0.164 0.122 0.126 0.155 0.078 −0.148 −0.173 P 0.246 0.390 0.374 0.273 0.581 0.295 0.219 DLCO/VA r 0.083 0.129 0.123 0.066 −0.081 −0.010 −0.038 P 0.561 0.362 0.385 0.642 0.568 0.945 0.787 RV/TLC r 0.230 0.300 0.308 0.283 0.136 −0.271 −0.245 P 0.100 0.030* 0.027* 0.042* 0.337 0.052 0.081 TLC% r 0.081 0.034 0.038 0.082 0.079 −0.108 −0.117 P 0.570 0.813 0.790 0.565 0.579 0.447 0.407 注:*为P<0.05。HAA%为高衰减区; Perc15为全肺像素CT直方图上第15百分位点对应的CT值;Perc10为全肺像素CT直方图上第10百分位点对应的CT值;MLA为平均肺衰减;SD为标准差; kurtosis为峰度,skewness为偏度;r为Spearman相关系数。FVC%为用力肺活量占预计值的百分比;FEV1%为第一秒用力呼气量占预计值的百分比;FEV1/FVC为第一秒用力肺活量占用力肺活量的百分比;DLCO/VA为一氧化碳转运系数;RV/TLC为残气量占肺总量的百分比;DLCO%为肺一氧化碳弥散量占预计值的百分比;TLC%为肺总量占预计值的百分比。
下载: 导出CSV
表 4 定量指标对疾病严重程度逻辑回归预测结果
Table 4 Results of logistic regression prediction of disease severity using quantitative indicators
项目 单因素 多因素 B BE P OR B BE P OR HAA% 0.197 0.044 <0.001 1.218 0.966 0.284 < 0.001 2.627 Perc10 0.023 0.006 <0.001 1.023 0.113 0.123 0.356 1.120 Perc15 0.023 0.006 <0.001 1.023 −0.003 0.170 0.984 0.997 MLA 0.016 0.004 <0.001 1.016 −0.150 0.079 0.058 0.860 SD 0.026 0.006 <0.001 1.027 0.054 0.049 0.271 1.056 Kurtosis −0.226 0.045 <0.001 0.798 −0.835 0.661 0.206 0.434 Skewness −1.454 0.295 <0.001 0.234 3.660 6.232 0.557 38.860 注:HAA%为高衰减区; Perc15为全肺像素CT直方图上第15百分位点对应的CT值;Perc10:全肺像素CT直方图上第10百分位点对应的CT值;MLA为平均肺衰减;SD为标准差; Kurtosis为峰度,Skewness为偏度;B为回归系数;BE为标准误;OR为比值比。
下载: 导出CSV
表 5 定量指标区分不同严重程度患者ROC曲线结果
Table 5 Results of ROC curves for quantitative indicators to differentiate between patients with different degrees of severity
项目 AUC P 最佳截断值 灵敏度 特异度 约登指数 HAA% 0.740 < 0.001 > 6.205 0.831 0.628 0.459 Perc10 0.678 < 0.001 > −951.500 0.554 0.770 0.324 Perc15 0.687 < 0.001 > −932.500 0.585 0.753 0.338 MLA 0.744 < 0.001 > −799.700 0.769 0.667 0.436 SD 0.742 < 0.001 > 205.700 0.754 0.731 0.485 Kurtosis 0.764 < 0.001 < 8.805 0.800 0.667 0.467 Skewness 0.756 < 0.001 < 2.695 0.815 0.658 0.473 联合指标 0.846 < 0.001 > 0.557 0.739 0.885 0.623 注:HAA%为高衰减区;Perc15为全肺像素CT直方图上第15百分位对应的CT值;Perc10为全肺像素CT直方图上第10百分位对应的CT值;MLD为平均肺衰减;SD为标准差;Kurtosis为峰度、Skewness为偏度;联合指标为逻辑回归计算HAA、Perc10、Perc15、MLD、SD、Kurtosis、Skewness 的合并预测概率;AUC为ROC曲线下面积。
下载: 导出CSV
-
[1] JEE A S, SHEEHY R, HOPKINS P, et al. Diagnosis and management of connective tissue disease-associated interstitial lung disease in Australia and New Zealand: A position statement from the Thoracic Society of Australia and New Zealand[J]. Respirology, 2021, 26(1): 23-51. DOI: 10.1111/resp.13977.
[2] JEGANATHAN N, SATHANANTHAN M. Connective tissue disease-related interstitial lung disease: Prevalence, patterns, predictors, prognosis, and treatment[J]. Lung, 2020, 198(5): 735-759. DOI: 10.1007/s00408-020-00383-w.
[3] COLAK S. Clinical characteristics of patients with connective tissue disease-related interstitial lung disease: A retrospective analysis[J]. Clinical Rheumatology, 2024, 43(5): 1693-1701. DOI: 10.1007/s10067-024-06926-3.
[4] MIRA-AVENDANO I, ABRIL A, BURGER C D, et al. Interstitial lung disease and other pulmonary manifestations in connective tissue diseases[J]. Mayo Clinic Proceedings, 2019, 94(2): 309-325. DOI: 10.1016/j.mayocp.2018.09.002.
[5] KUWANA M, BANDO M, KAWAHITO Y, et al. Identification and management of connective tissue disease-associated interstitial lung disease: Evidence-based Japanese consensus statements[J]. Expert Review of Respiratory Medicine, 2023, 17(1): 71-80. DOI: 10.1080/17476348.2023.2176303.
[6] CARON M, HOA S, HUDSON M, et al. Pulmonary function tests as outcomes for systemic sclerosis interstitial lung disease[J]. European Respiratory Review, 2018, 27(148): 170102. DOI: 10.1183/16000617.0102-2017.
[7] RAGHU G, REMY-JARDIN M, RICHELDI L, et al. Idiopathic pulmonary fibrosis (an update) and progressive pulmonary fibrosis in adults: An official ATS/ERS/JRS/ALAT clinical practice guideline[J]. American Journal of Respiratory and Critical Care Medicine, 2022, 205(9): e18-e47. DOI: 10.1164/rccm.202202-0399ST.
[8] ALETAHA D, NEOGI T, SILMAN A J, et al. 2010 Rheumatoid arthritis classification criteria: An American College of Rheumatology/European League Against Rheumatism collaborative initiative[J]. Annals of the Rheumatic Diseases, 2010, 69(9): 1580-1588. DOI: 10.1136/ard.2010.138461.
[9] Van den HOOGEN F, KHANNA D, FRANSEN J, et al. 2013 classification criteria for systemic sclerosis: An American college of rheumatology/European league against rheumatism collaborative initiative[J]. Annals of the Rheumatic Diseases, 2013, 72(11): 1747-1755. DOI: 10.1136/annrheumdis-2013-204424.
[10] LUNDBERG I E, TJÄRNLUND A, BOTTAI M, et al. 2017 European League Against Rheumatism/American College of Rheumatology Classification Criteria for adult and juvenile idiopathic inflammatory myopathies and their major subgroups[J]. Arthritis & Rheumatology, 2017, 69(12): 2271-2282. DOI: 10.1002/art.40320.
[11] ARINGER M, COSTENBADER K, DAIKH D, et al. 2019 European League Against Rheumatism/American College of Rheumatology Classification Criteria for Systemic Lupus Erythematosus[J]. Arthritis & Rheumatology, 2019, 71(9): 1400-1412. DOI: 10.1002/art.40930.
[12] YAZICI H, TASCILAR K, YAZICI Y. 2022 American College of Rheumatology/European Alliance of Associations for Rheumatology classification criteria sets for three types of antineutrophilic cytoplasmic antibody-associated vasculitis[J]. Current Opinion in Rheumatology, 2023, 35(1): 1-5. DOI: 10.1097/BOR.0000000000000916.
[13] SHIBOSKI C H, SHIBOSKI S C, SEROR R, et al. 2016 American College of Rheumatology/European League Against Rheumatism Classification Criteria for Primary Sjögren’s Syndrome: A consensus and data-driven methodology involving three international patient cohorts[J]. Arthritis & Rheumatology, 2017, 69(1): 35-45. DOI: 10.1002/art.39859.
[14] TANAKA Y, KUWANA M, FUJII T, et al. 2019 diagnostic criteria for mixed connective tissue disease (MCTD): From the Japan research committee of the ministry of health, labor, and welfare for systemic autoimmune diseases[J]. Modern Rheumatology, 2021, 31(1): 29-33. DOI: 10.1080/14397595.2019.1709944.
[15] TRAVIS W D, COSTABEL U, HANSELL D M, et al. An official American Thoracic Society/European Respiratory Society Statement: Update of the international multidisciplinary classification of the idiopathic interstitial pneumonias[J]. American Journal of Respiratory and Critical Care Medicine, 2013, 188(6): 733-748. DOI: 10.1164/rccm.201308-1483ST.
[16] WARRICK J H, BHALLA M, SCHABEL S I, et al. High resolution computed tomography in early scleroderma lung disease[J]. The Journal of Rheumatology, 1991, 18(10): 1520-1528.
[17] 孙智慧, 王晓磊. 间质性肺疾病肋间肌超声弹性成像与高分辨CT评分相关性研究[J]. 影像研究与医学应用, 2023, 7(9): 47-49. DOI: 10.3969/j.issn.2096-3807.2023.09.015. SUN Z H, WANG X L. Study on correlation between ultrasonic elastography and high resolution CT score of intercostal muscle in interstitial lung disease[J]. Journal of Imaging Research and Medical Applications, 2023, 7(9): 47-49. DOI: 10.3969/j.issn.2096-3807.2023.09.015. (in Chinese).
[18] 林砺, 李雪颖, 蔡逸婷, 等. 支气管肺泡灌洗液中细胞及细胞因子对间质性肺病纤维化程度的诊断价值初探[J]. 中华检验医学杂志, 2024, 47(10): 1152-1158. DOI: 10.3760/cma.j.cn114452-20240326-00164. LI L, LI X Y, CAI Y T, et al. The diagnostic value of cells and cytokines in bronchoalveolar lavage fluid to the degree of fibrosis in interstitial pulmonary disease[J]. Chinese Journal of Laboratory Medicine, 2024, 47(10): 1152-1158. DOI: 10.3760/cma.j.cn114452-20240326-00164. (in Chinese).
[19] GOH N S L, DESAI S R, VEERARAGHAVAN S, et al. Interstitial lung disease in systemic sclerosis: A simple staging system[J]. American Journal of Respiratory and Critical Care Medicine, 2008, 177(11): 1248-1254. DOI: 10.1164/rccm.200706-877OC.
[20] KARADAG D T, DOGAN S, GOKCEN N, et al. Warrick score in rheumatoid-arthritis interstitial lung disease: A promising tool for assessing the extent and progression of lung involvement[J]. Advances in Rheumatology, 2025, 65(1). DOI: 10.1186/s42358-025-00435-w.
[21] 杨凯, 张静平, 何立宇, 等. 基于定量CT评估多发性肌炎/皮肌炎相关间质性肺病患者肺部改变[J]. 中国临床医学影像杂志, 2024, 35(10): 694-699. YANG K, ZHANG J P, HE L Y, et al. Evaluation of pulmonary changes in patients with polymyositis/dermatomyositis-associated interstitial lung disease based on quantitative CT[J]. Journal of China Clinic Medical Imaging, 2024, 35(10): 694-699. (in Chinese).
[22] TEMIZ KARADAG D, CAKIR O, SAN S, et al. Association of quantitative computed tomography ındices with lung function and extent of pulmonary fibrosis in patients with systemic sclerosis[J]. Clinical Rheumatology, 2022, 41(2): 513-521. DOI: 10.1007/s10067-021-05918-x.
[23] HASAN D, IMAM H, MEGALLY H, et al. The qualitative and quantitative high-resolution computed tomography in the evaluation of interstitial lung diseases[J]. Egyptian Journal of Radiology and Nuclear Medicine, 2020, 51(1): 135. DOI: 10.1186/s43055-020-00254-7.
[24] GUISADO-VASCO P, SILVA M, DUARTE-MILLÁN M A, et al. Quantitative assessment of interstitial lung disease in Sjögren’s syndrome[J]. PLoS ONE, 2019, 14(11): e0224772. DOI: 10.1371/journal.pone.0224772.
[25] UFUK F, DEMIRCI M, ALTINISIK G. Quantitative computed tomography assessment for systemic sclerosis-related interstitial lung disease: Comparison of different methods[J]. European Radiology, 2020, 30(8): 4369-4380. DOI: 10.1007/s00330-020-06772-2.
[26] 郭红红, 曹珊, 杨晨, 等. 结缔组织病相关间质性肺疾病的CT定量分析研究进展[J]. 放射学实践, 2023, 38(11): 1467-1471. DOI: 10.13609/j.cnki.1000-0313.2023.11.018. [27] BRUNI C, TOFANI L, GARAIMAN A, et al. Histogram-based densitometry index to assess the severity of interstitial lung disease in systemic sclerosis in standard and low-dose computed tomography[J]. The Journal of Rheumatology, 2024, 51(3): 270-276. DOI: 10.3899/jrheum.2023-0415. (in Chinese).
[28] ALEVIZOS M K, DANOFF S K, PAPPAS D A, et al. Assessing predictors of rheumatoid arthritis-associated interstitial lung disease using quantitative lung densitometry[J]. Rheumatology, 2022, 61(7): 2792-2804. DOI: 10.1093/rheumatology/keab828.
[29] CHOI B, KAWUT S M, RAGHU G, et al. Regional distribution of high-attenuation areas on chest computed tomography in the multi-ethnic study of atherosclerosis[J]. European Respiratory Journal Open Research, 2020, 6(1): 00115-2019. DOI: 10.1183/23120541.00115-2019.


计量
- 文章访问数: 72
- HTML全文浏览量: 17
- PDF下载量: 12


