
Correlation between Dual-Phase Quantitative Parameters from Dual-Layer Spectral Detector Computed Tomography and Ki-67 Expression in Non-Small Cell Lung Cancer
-
摘要:
目的:研究双层探测器光谱CT(DLSCT)双期定量参数对非小细胞肺癌Ki-67表达的预测价值。方法:回顾性分析我院自2022年8月至2024年12月进行DLSCT双期增强扫描且经病理证实的非小细胞肺癌患者77例,按免疫组化结果分为低表达组(Ki-67≤30%)、高表达组(Ki-67>30%)。使用Spectral CT viewer软件测量、计算、分析两组病例动脉期和静脉期的双层光谱CT定量参数,包括碘密度(IC)、标准化碘密度(NIC)、有效原子序数(Zeff)、能谱曲线斜率(K40-100 keV,简称K)、MonoE(单能量光谱结果)间隔10 keV的CT40 keV-CT100 keV。统计学方法:采用独立样本t检验方法比较组间差异;用Spearman相关分析评价DLSCT双期定量参数和Ki-67表达水平间的相关性;绘制受试者工作曲线(ROC),获得曲线下面积(AUC),约登指数、敏感度、特异度衡量DLSCT各定量参数评估Ki-67表达水平的效能。结果:静脉期低表达组IC、NIC、Zeff、K40-100 keV、CT40 keV-CT70 keV(间隔10 keV)均高于高表达组,动脉期低表达组K40-100 keV、CT40 keV高于高表达组,差异均具有统计学意义。静脉期IC、NIC、Zeff、K40-100 keV、CT40 keV-CT60 keV(间隔10 keV)、动脉期K40-100 keV、CT40 keV与Ki-67表达水平呈负相关。绘制ROC,静脉期K40-100 keV评估非小细胞肺癌Ki-67表达水平最佳。结论:DLSCT双期定量参数是预测非小细胞肺癌 Ki-67 表达水平的有效工具,研究证据表明静脉期能谱曲线斜率 (K) 是其中最具预测价值的指标。
Abstract:Objective: We investigated the predictive value of dual-phase quantitative parameters of dual-layer spectral detector computed tomography (DLSCT) combined with Ki-67 expression in non-small-cell lung cancer (NSCLC). Methods: Seventy-seven patients with pathologically confirmed non-small cell lung cancer who underwent dual-phase enhanced scanning at our hospital between August 2022 and December 2024 were retrospectively analyzed. According to immunohistochemical results, they were divided into low (Ki-67≤30%) and high (Ki-67>30%) Ki-67 expression groups. Spectral CT viewer software was used to measure, calculate, and analyze the quantitative parameters obtained with dual-layer spectral CT in the arterial and venous phases in both groups, including iodine density (IC), standardized iodine density (NIC), effective atomic number (Zeff), and energy spectrum curve slope (K, P < 0.05) (referred to as K and MonoE [monochromatic energy spectroscopy]) results, and CT40 keV-CT100 keV at 10 keV intervals. An independent samples t-test was used to compare differences between groups. Spearman’s correlation analysis was used to evaluate the correlation between the quantitative parameters of DLSCT and Ki-67 expression. A receiver-operating characteristic (ROC) curve was constructed to obtain the area under the curve (AUC). Youden index, sensitivity, and specificity were used to measure the efficacy of each quantitative parameter of DLSCT in predicting Ki-67 expression. Results: IC, NIC, Zeff, K40-100 keV, CT40 keV-CT70 keV (interval 10 keV) were higher in the low expression group than in the high expression group in venous phase, and K40-100 keV and CT40 keV were higher in the low expression group than in the high expression group in arterial phase. The differences were statistically significant (P<0.05). IC, NIC, Zeff, K40-100 keV, CT40 keV-CT60 keV (interval 10 keV) in venous phase, and K40-100 keV, CT40 keV in arterial phase correlated negatively with Ki-67 expression level (|r| < 0.40,P < 0.05). The ROC curve showed that K40-100 keV in venous phase was the best parameter for predicting Ki-67 expression in NSCLC (AUC=0.750). Conclusion: Dual-phase quantitative parameters of DLSCT are effective tools for predicting Ki-67 expression in non-small cell lung cancer, and research evidence shows that the slope (K) of the spectral curve in the venous phase is the most valuable index.
-
Keywords:
- spectral CT /
- carcinoma non-small-celllung /
- Ki-67 proliferation.
-
-
![]()
图 1 患者女,55岁,右肺下叶腺癌(圆圈为ROI),Ki-67为3%
注:(a)~(d)依次为有效原子序数图(Zeff=8.13)、碘密度图(IC=1.54)、胸部40 keV单能量图(CT40 keV=184.446)、能谱曲线图(K=1.94)。
Figure 1. A 55-year-old female patient with adenocarcinoma of the right lower lobe of the lung (circle is ROI), Ki-67 was 3%
![]()
图 2 患者女,66岁,右肺上叶鳞癌(圆圈为ROI),Ki-67为60%
注:(a)~(d)依次为有效原子序数图(Zeff=7.94)、碘密度图(IC=1.12)、胸部40 keV单能量图(CT40 keV=133.940)、能谱曲线图(K=1.36)。
Figure 2. A 66-year-old female patient with squamous cell carcinoma in the right upper lobe of the lung (circle is ROI), Ki-67 was 60%
![]()
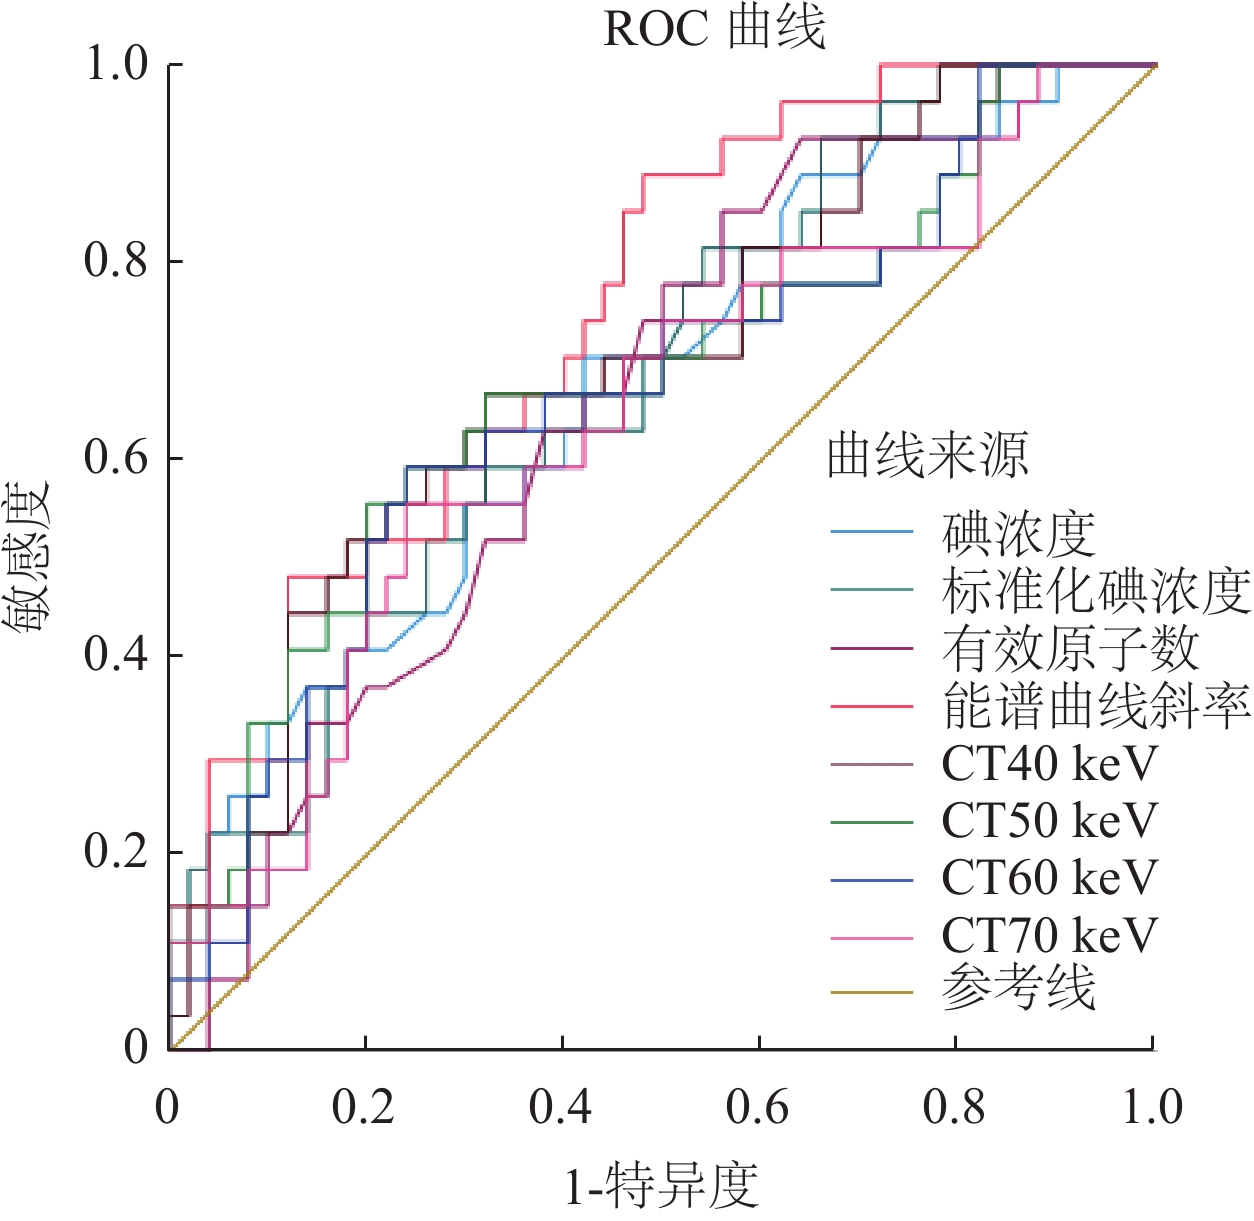
图 3 静脉期光谱CT各参数鉴别Ki-67高表达组与非高表达组的ROC曲线
Figure 3. ROC curve of each parameter of venous phase spectral CT for identifying high and low Ki-67 expression groups
![]()
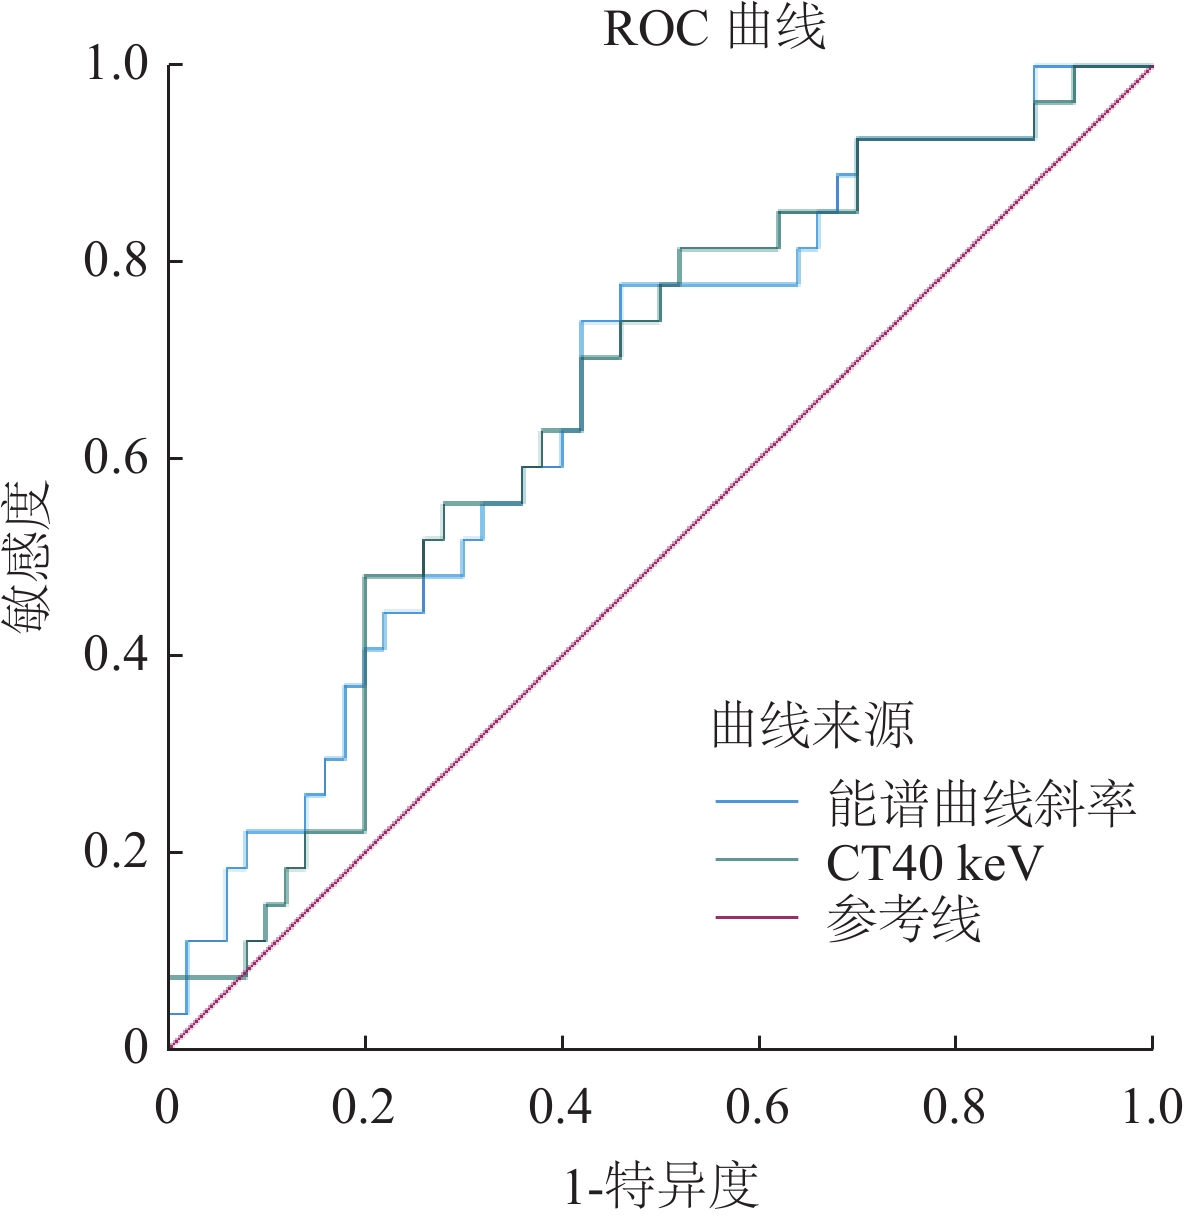
图 4 动脉期光谱各参数鉴别Ki-67高表达组与非高表达组的ROC曲线
Figure 4. The receiver operating characteristic (ROC) curve of each parameter of arterial phase spectral CT in identifying high and low Ki-67 expression groups
表 1 Ki-67高、低表达组静脉期光谱CT各参数比较
Table 1 Comparison of spectral CT parameters in venous phase from high and low Ki-67 expression groups
参数 组别 统计检验 低表达组 高表达组 t值 P值 n 27 50 IC/(mg/mL) 1.37±0.39 1.12±0.36 2.9 0.01 NIC 0.31±0.08 0.25±0.08 3.27 <0.01 Zeff 8.08±0.18 7.95±0.26 2.3 0.02 K40-100 keV 1.87±0.44 1.43±0.48 3.93 <0.01 CT40 keV/HU 164.68±32.27 137.72±34.98 3.31 <0.01 CT50keV/HU 121.38±26.42 103.3±25.39 2.94 <0.01 CT60 keV/HU 93.03±17.37 81.84±17.87 2.65 0.01 CT70 keV/HU 75.8±13.62 68.37±13.14 2.34 0.02 CT80 keV/HU 63.86±12.76 60.71±11.53 1.1 0.28 CT90 keV/HU 56.6±12.92 55.38±9.96 0.46 0.65 CT100 keV/HU 52.68±11.97 51.78±9.02 0.37 0.71  下载: 导出CSV
表 2 Ki-67高、低表达组动脉期光谱CT各参数比较
Table 2 Comparison of arterial phase spectral CT parameters from high and low Ki-67 expression groups
参数 组别 统计检验 低表达组 高表达组 t值 P值 n 27 50 IC/(mg/mL) 1.31±0.39 1.15±0.36 1.5 0.14 NIC 0.11±0.03 0.09±0.04 1.75 0.08 Zeff 7.99±0.24 7.95±0.26 0.66 0.51 K40-100 keV 1.61±0.45 1.33±0.50 2.42 0.02 CT40 keV/HU 150.30±31.75 132.03±35.03 2.26 0.03 CT50keV/HU 109.08±21.23 100.58±24.32 1.53 0.13 CT60 keV/HU 86.11±15.43 80.42±16.98 1.45 0.15 CT70 keV/HU 72.69±12.37 68.32±12.50 1.47 0.15 CT80 keV/HU 63.54±10.60 60.60±9.96 1.21 0.23 CT90 keV/HU 57.66±9.72 55.51±8.26 1.03 0.31 CT100 keV/HU 53.54±9.23 52.01±7.19 0.81 0.42
下载: 导出CSV
表 3 静脉期光谱CT各参数与Ki-67表达水平的相关性分析
Table 3 Correlation analysis between Ki-67 expression and parameters from venous phase spectral CT
r值 P值 分组 1 IC(mg/ml) −0.267 0.02 NIC −0.297 0.01 Zeff −0.251 0.03 K40-100 keV −0.398 <0.01 CT40 keV(HU) −0.315 0.01 CT50keV(HU) −0.278 0.01 CT60 keV(HU) −0.243 0.03 CT70 keV(HU) −0.194 0.10 CT80 keV(HU) −0.062 0.60 CT90 keV(HU) −0.007 −0.95 CT100 keV(HU) −0.007 0.95
下载: 导出CSV
表 4 动脉期光谱CT各参数与Ki-67表达水平的相关性分析
Table 4 Correlation analysis between Ki-67 expression and parameters from arterial phase spectral CT
分组 K40-100 keV CT40 keV(HU) r值 1 −0.225 −0.225 P值 0.05 <0.05
下载: 导出CSV
表 5 光谱CT各参数诊断Ki-67高表达组与非高表达组肺癌病灶的效能
Table 5 Efficacy of spectral CT parameters in diagnosis of lung cancer lesions in the high Ki-67 group and the low Ki-67 group
指标 约登指数 临界值 敏感度(%) 特异度(%) AUC 95%CI IC (V) 0.284 1.145 70.4 58.0 0.674 0.549-0.799 NIC(V) 0.275 0.245 81.5 46.0 0.683 0.561-0.804 Zeff(V) 0.292 7.925 85.2 44.0 0.660 0.538-0.782 K40-100 keV(V) 0.409 1.366 88.9 52.0 0.750 0.641-0.859 CT40 keV(V) 0.347 150.772 66.7 68.0 0.698 0.575-0.820 CT50 keV(V) 0.356 116.921 55.6 80.0 0.679 0.549-0.809 CT60 keV(V) 0.353 89.047 59.3 76.0 0.666 0.536-0.796 CT70 keV(V) 0.316 74.610 55.6 76.0 0.644 0.513-0.776 K40-100 keV(A) 0.321 1.407 74.1 58.0 0.662 0.537-0.788 CT40 keV(A) 0.295 130.264 81.5 48.0 0.657 0.531-0.783 注:AUC:曲线下面积;CT40 keV(V)、CT40 keV(A):分别代表静脉期CT40 keV、动脉期CT40 keV,余数据以此类推。
下载: 导出CSV
-
[1] KIRI S, RYBA T. Cancer, metastasis, and the epigenome[J]. Molecular Cancer, 2024, 23(1): 154. DOI: 10.1186/s12943-024-02069-w.
[2] SIEGEL R L, GIAQUINTO A N, JEMAL A. Cancer statistics, 2024[J]. CA: a cancer journal for clinicians, 2024, 74(1). DOI: 10.3322/caac.21820
[3] LEITER A, VELUSWAMY R R, WISNIVESKY J P. The global burden of lung cancer: current status and future trends[J]. Nature reviews Clinical oncology, 2023, 20(9): 624-639. DOI: 10.1038/s41571-023-00798-3.
[4] MROUJ K, ANDRéS-SáNCHEZ N, DUBRA G, et al. Ki-67 regulates global gene expression and promotes sequential stages of carcinogenesis[J]. Proceedings of the National Academy of Sciences, 2021, 118(10): e2026507118. DOI: 10.1073/pnas.2026507118.
[5] LUO X, ZHENG R, ZHANG J, et al. CT-based radiomics for predicting Ki-67 expression in lung cancer: a systematic review and meta-analysis[J]. Frontiers in Oncology, 2024, 14: 1329801. DOI: 10.3389/fonc.2024.1329801.
[6] DENG L, YANG J, ZHANG M, et al. Whole-lesion iodine map histogram analysis versus single-slice spectral CT parameters for determining novel International Association for the Study of Lung Cancer grade of invasive non-mucinous pulmonary adenocarcinomas[J]. Diagnostic and Interventional Imaging, 2024, 105(5): 165-173. DOI: 10.1016/j.diii.2023.12.001.
[7] MA Y, LI S, HUANG G, et al. Role of iodine density value on dual-energy CT for detection of high tumor cell proportion region in lung cancer during CT-guided transthoracic biopsy[J]. European Journal of Radiology, 2023, 160: 110689. DOI: 10.1016/j.ejrad.2023.110689.
[8] LIN L, CHENG J, TANG D, et al. The associations among quantitative spectral CT parameters, Ki-67 expression levels and EGFR mutation status in NSCLC.[J]. Sci Rep, 2020, 1: 3436. DOI: 10.1038/s41598-020-60445-0.
[9] ZHU T, XIE K, WANG C, et al. Diagnostic Effectiveness of Dual Source Dual Energy Computed Tomography for Benign and Malignant Thyroid Nodules[J]. Evidence‐Based Complementary and Alternative Medicine, 2022, 2022(1): 2257304. DOI: 10.1155/2022/2257304.
[10] 中华放射学杂志双层探测器光谱CT临床应用协作组. 双层探测器光谱CT临床应用中国专家共识(第一版)[J]. 中华放射学杂志, 2020, 54(7): 635-643. DOI: 10.3760/cma.j.cn112149-20200513-00679. CHINESE JOURNAL OF RADIOLOGY DUAL-LAYER SPECTRAL DETECTOR CT CLINICAL APPLICATION COLLABORATIVE GROUP. Chinese expert consensus on clinical application of dual-layer spectral detector CT (first edition)[J]. Chinese Journal of Radiology, 2020, 54(7): 635-643. DOI: 10.3760/cma.j.cn112149-20200513-00679.
[11] FULTON N, RAJIAH P. Abdominal applications of a novel detector-based spectral CT[J]. Current Problems in Diagnostic Radiology, 2018, 47(2): 110-118. DOI: 10.1067/j.cpradiol.2017.05.001.
[12] ZHANG Z, ZOU H, YUAN A, et al. A Single Enhanced Dual-Energy CT Scan May Distinguish Lung Squamous Cell Carcinoma From Adenocarcinoma During the Venous phase.[J]. Acad Radiol, 2020, 5: 624-629. DOI: 10.1016/j.acra.2019.07.018.
[13] 薛莉雅, 赵卫东, 苏琳, 等. 双层探测器光谱CT多参数成像在不同病理类型肺癌中的应用[J]. 中国CT和MRI杂志, 2023, 21(12): 52-55. DOI: 10.3969/j.issn.1672-5131.2023.12.016. XUE L Y, ZHAO W D, SU L, et al. Application of multi-parameter imaging of dual-layer spectral detector CT in different pathological types of lung cancer[J]. Chinese journal of CT and MRI, 2023, 21(12): 52-55. DOI: 10.3969/j.issn.1672-5131.2023.12.016.
[14] 刘秀丽, 张戟风, 刘景旺, 等. 能谱CT在中央型肺癌伴阻塞性肺不张诊断及放疗定位中应用价值[J]. CT理论与应用研究, 2023, 32(4): 509-514. DOI: 10.15953/j.ctta.2022.164. LIU X L, ZHANG J F, LIU J W, et al. The value of Spectral CT in differential diagnosis and ra-diotherapy localiation of central lung cancer with obstructive atelectasis[J]. CT Theory and App-lications, 2023, 32(4): 509-514. DOI: 10.15953/j.ctta.2022.164.
[15] WU J, LV Y, WANG N, et al. The value of single-source dual-energy CT imaging for discriminating microsatellite instability from microsatellite stability human colorectal cancer.[J]. Eur Radiol, 2019, 7: 3782-3790. DOI: 10.1007/s00330-019-06144-5.
[16] 田双凤, 杨萌, 夏建国, 等. 实性肺癌能谱CT参数与Ki-67表达水平的相关性研究[J]. 影像诊断与介入放射学, 2021, 30(1): 20-24. DOI: 10.3969/j.issn.1005-8001.2021.01.004. TIAN S F, YANG M, XIA J G, et al. Correlation between spectral CT parameters and Ki-67 expression in solid lung cancer [J]. The imaging diagnosis and interventional radiology, 2021, 30 (1) : 20 to 24. DOI: 10.3969 / j.i SSN. 1005-8001.2021.01.004.
[17] 周潋滟, 张浩荡, 殷世武. 双层光谱CT评估非小细胞肺癌Ki-67表达水平的可行性[J]. 中国介入影像与治疗学, 2023, 20(2): 107-111. DOI: 10.13929/j.issn.1672-8475.2023.02.011. ZHOU L Y, ZHANG H D, YIN S W. Feasibility of assessing Ki-67 expression level in non-small cell lung cancer using dual-layer spectral CT[J]. Chinese interventional imaging and therapy, 2023, 20(2): 107-111. DOI: 10.13929/j.issn.1672-8475.2023.02.011.
[18] MAO L T, CHEN W C, LU J Y, et al. Quantitative parameters in novel spectral computed tomography: Assessment of Ki-67 expression in patients with gastric adenocarcinoma[J]. World Journal of Gastroenterology, 2023, 29(10): 1602. DOI: 10.3748/wjg.v29.i10.1602.
[19] ZEGADŁO A, ŻABICKA M, RóŻYK A, et al. A new outlook on the ability to accumulate an iodine contrast agent in solid lung tumors based on virtual monochromatic images in dual energy computed tomography (DECT): Analysis in two phases of contrast enhancement[J]. Journal of Clinical Medicine, 2021, 10(9): 1870. DOI: 10.3390/jcm10091870.
[20] WU Y, LI J, DING L, et al. Differentiation of pathological subtypes and Ki-67 and TTF-1 expression by dual-energy CT (DECT) volumetric quantitative analysis in non-small cell lung cancer[J]. Cancer Imaging, 2024, 24(1): 146. DOI: 10.1186/s40644-024-00793-6.
[21] DOU P, LIU Z, XIE L, et al. The predictive value of energy spectral CT parameters for assessing Ki-67 expression of lung cancer[J]. Translational Cancer Research, 2020, 9(7): 4267. DOI: 10.21037/tcr-19-2769a.
[22] 窦沛沛, 赵恒亮, 曹爱红. 能谱CT联合肿瘤标志物预测肺腺癌Ki-67表达[J]. CT理论与应用研究, 2023, 32(6): 753-760. DOI: 10.15953/j.ctta.2022.172. DOU P P, ZHAO H L, CAO A H. Spectral CT combined with tumor markers to predict Ki-67 expression in lung adenocarcinoma[J]. CT Theory and Applications, 2023, 32(6): 753-760. DOI: 10.15953 / j.carol carroll tta. 2022.172. DOI: 10.15953/j.ctta.2022.172.
[23] YU J, LIN S, LU H, et al. Optimize scan timing in abdominal multiphase CT: Bolus tracking with an individualized post-trigger delay. [J]. Eur J Radiol, 2022: 110139. DOI: 10.1016/j.ejrad.2021.110139
[24] QI K, LI L, YUAN D, et al. Optimized contrast enhancement and homogeneity in aortic CT angiography: bolus tracking with personalized post-trigger delay[J]. Quantitative Imaging in Medicine and Surgery, 2024, 15(1): 709. DOI: 10.21037/qims-24-624.
[25] YUAN D, LI L, ZHANG Y, et al. Image quality improvement in head and neck CT angiography: Individualized post-trigger delay versus fixed delay. [J]. Eur J Radiol, 2023, 111142. DOI: 10.1016/j.ejrad.2023.111142


计量
- 文章访问数: 0
- HTML全文浏览量: 0
- PDF下载量: 0


