
Phantom Study on the Influence of CT Model and Tube Voltage on Image Quality
-
摘要: 目的:使用体模评价两种CT机型两组管电压下的图像质量。方法:采用西门子SOMATOM Force CT和飞利浦IQon Spectral CT分别扫描Catphan500图像质量控制体模的CTP 528和CTP 515组件。对比研究两台机器4组图像,分别为Force<sub<120kVp</sub<,Force<sub<140kVp</sub<,IQon<sub<120kvp</sub<以及IQon<sub<140kvp</sub<图像;4组图像均为20 mGy剂量。评价指标包括高对比度分辨率[CTP 528最佳线对(1~2 lp/cm)]、低对比度分辨率[CTP 515 1% 浓度下最小孔径(直径2~15 mm)]、图像噪声、对比噪声比(CNR)和信噪比(SNR)。结果:Force<sub<120kVp</sub<和IQon<sub<120kvp</sub<两组图像的高对比度分辨率最高(均为6 lp/cm)。4组图像低对比度分辨率相同(最小孔径均为5 mm)。Force<sub<120kVp</sub<图像噪声最小(2.500±0.000),且SNR最高(30.806±1.398);噪声和SNR在4组图像间差异具有统计学意义。IQon<sub<140kvp</sub<图像的CNR最高(3.325±0.300),各组图像间差异无统计学意义。结论:不同机型不同管电压下的图像质量存在差异;两台机器120 kVp图像的对比度分辨率略好于140 kVp图像;Force CT的120 kVp图像相比140 kVp图像的图像噪声更小,而IQon Spectral CT的两组图像噪声参数无显著差别。Abstract: Objective: To compare the image quality between two CT scanners under two different tube voltages using a dedicated phantom. Materials and Methods: Siemens SOMATOM Force CT and Phillips Spectral IQon CT were used for scanning and the dedicated Assurance Quality Phantom Catphan 500 was applied. Module CTP 528 and CTP 515 were performed for evaluation of high resolution and low-contrast sensitivity, respectively. Four sets of images of two scanners were acquired, including group A to D whic represented force 120 kVp, force 140 kVp, IQon 120 kVp and IQon 140 kVp. The dosage of all four set of images was 20mGy.Evaluation of high resolution was carried out by two radiologists via the smallest line pair one could distinguish and low-contrast sensitivity was measured by the smallest diameter under 1% contrast. Mean noise, signal-to -oise ratio (SNR) and contrast-to-noise ratio (CNR) were also evaluated for each group. Results: Group A and C had the highest high resolution with a line pair of 6 lp/cm; the same low-contrast sensitivity was observed by all the groups (diameter of 5 mm). Group A showed the smallest noise (2.500±0.000) and highest SNR (30.806±1.398). Noise and SNR were both significantly different among four groups. The highest CNR (3.325±0.300) was observed in Group D, but no statistical difference was found among the four groups. Conclusion: Image quality varied under different CT scanners and tube voltages. Images with 120 kVp showed better contrast compared with those with 140 kVp. 120 kVp with force CT showed improved image noise than that of 140 kVp images; while for IQon spectral CT, no obvious difference in noise parameters was found between the two tube voltages.
-
Keywords:
- CT /
- tube voltage /
- image quality /
- phantom
-
CT是目前临床上诊治疾病最常用的影像学手段之一,但由于X线的辐射特性,剂量问题一直受到公众的担忧。CT检查以每年10% 以上的速度增长,而辐射剂量也由上世纪80年代的0.54 mSv增加到了3 mSv以上[1-2]。CT检查虽只占整个放射检查的很小比例,但造成的辐射却占到了所有放射检查的一半左右[1]。以胸部检查举例,CT造成的辐射剂量是平片的100倍以上[3]。调查显示,每年大约有1.2%~2% 的新发肿瘤由CT扫描引起[4-6]。
如何在保持图像质量的同时降低辐射剂量,是目前CT临床研究的主要改进方向和研究热点[7-8]。管电压除与剂量明显相关以外,还是图像质量的重要影响因素,但目前针对不同CT机器的管电压对比的相关研究较少。研究表明,由于厂商调校的差异,不同机型对CT值等定量参数的准确性方面存在一定的差异[9-12],对于拥有多机型的医院来说统一的诊断标准非常重要。因此,本研究旨在通过体模研究对比两种机型两组管电压下的图像质量。
1. 材料与方法
1.1 材料
选用Catphan 500图像质量控制模体的CTP 528模块和CTP 515模块进行图像质量评价。其中CTP 528模块为高对比度检测组件,直径15 cm,厚度4 cm,有21组高密度线对结构呈放射状分布,分辨率为1~21 lp/cm;CTP 515的直径15 cm,厚4 cm,内外两组低密度孔经结构呈放射状分布,内层孔阵浓度分别为0.3%、0.5% 和1.0%,内层孔径直径分别对应为3、5、7和9 mm;外层孔阵浓度分别为0.3%、0.5% 和1.0%,外层孔径直径分别对应为2、3、4、5、6、7、8、9和15 mm。
1.2 扫描方法
采用西门子SOMATOM Force CT和飞利浦IQon Spectral CT分别扫描CTP 528和CTP 515两个组件。每台机器分别采取120 kVp和140 kVp两种单能电压扫描方案共产生4组图像,分别为A组Force120kVp、B组Force140kVp、C组IQon120kVp和D组IQon140kVp图像。4组图像扫描剂量均为20 mGy,重建层厚均为5 mm。
具体扫描参数。A组管电流299 mAs,B组图像205 mAs,其余参数两组一致:螺距1.0,旋转时间1 s,准直宽度192×0.6 mm,迭代重建算法ADMIRE(level 2,0~5),标准滤波函数Br40。C组管电流221 mAs,D组管电流154 mAs,其余参数两组一致:螺距1.014,旋转时间0.75 s,准直宽度64×0.625 mm,迭代重建算法iDose4(level 3,0~6),标准滤波函数Standard(B)。
1.3 图像质量评价
1.3.1 高对比度分辨率和低对比度分辨率评价
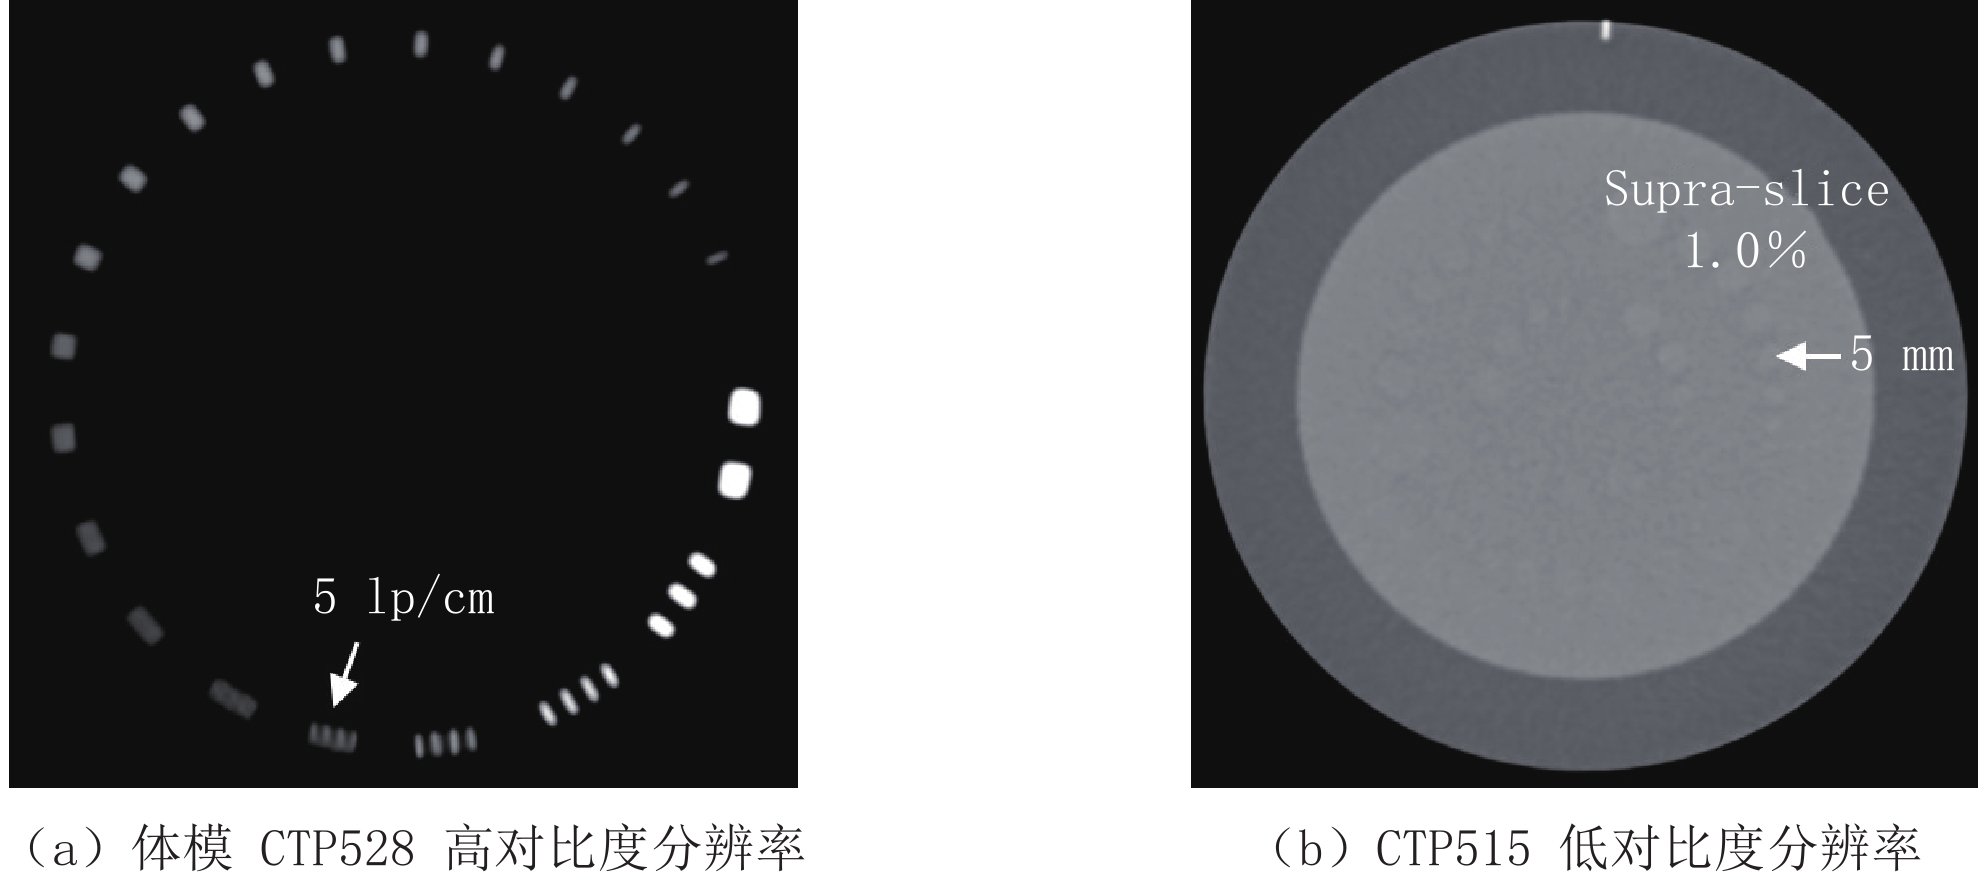
由两名放射科医师分别记录CTP 528高对比度分辨率组件的最佳的线对(1~2 lp/cm,图1(a))以及CTP 515低对比度分辨率组件的1% 浓度下的最小孔径(直径2~15 mm,要求分辨80% 以上有效面积,图1(b)),比较两名医师的主观评价结果,如有分歧则由另一名高年资医生做最终评判。两个指标均在组件中心及上下共3个层面进行测量以记录各组图像最优结果。
![]() 图 1 Force140 kVp图像的Catphan 500体模CTP 528高对比度分辨率和CTP 515低对比度分辨率测量Figure 1. Measurement of CTP 528 high contrast resolution and CTP 515 low contrast resolution of Catphan 500 phantom of Force 140 kVp image
图 1 Force140 kVp图像的Catphan 500体模CTP 528高对比度分辨率和CTP 515低对比度分辨率测量Figure 1. Measurement of CTP 528 high contrast resolution and CTP 515 low contrast resolution of Catphan 500 phantom of Force 140 kVp image1.3.2 图像噪声、信噪比和对比噪声比评价
将Froce和IQon的图像分别传至西门子Syngo Via(版本VB10)和飞利浦Intellispace Portal(版本10.1)后处理工作站上,由以上两名放射科医师对CTP 515模块图像进行测量。采用两个面积均为100 mm2的圆形感兴趣区域(ROI)分别测量1% 浓度组的15 mm孔径和邻近固态水背景的CT值(CTm和CTw,单位HU)。将15 mm孔径ROI标准差(SD,单位HU)定义为噪声,随后计算各组图像的信噪比(signal noise ratio,SNR=CTm/SD)和对比噪声比[contrast noise ratio,CNR= (CTm - CTw)/SD]。
所有主观及客观评价指标均在各组件中心的连续3个层面上进行测量;取两名医师测量的SD、CTm和CTw的均值计算各组图像的SNR和CNR。
1.4 统计学分析
运用SPSS 22.0版本软件进行数据分析,连续性指标采用平均值±标准差表示。4组图像的噪声值、SNR及CNR的比较采用单因素方差分析。两名医生对高/低对比度分辨率的主观一致性评价采用Cohen's Kappa检验,对图像噪声、CTm和CTw的客观一致性评价采用Spearman相关性分析。两台机器内部的噪声参数的比较采用独立样本t检验;以P<0.05认为差异具有统计学意义。
2. 结果
2.1 四组图像高对比度分辨率及低对比度分辨率比较
Force120kVp组和IQon120kVp组图像具有最好的高对比度分辨率,线对均为6 lp/cm,其余两组的线对均为5 lp/cm。4组图像低对比度分辨率相同,孔径均为5 mm。
2.2 四组图像噪声、CNR和SNR比较
各组图像的噪声值和SNR间差异均具有统计学意义,其中IQon120kVp组图像噪声最大(3.400±0.050),SNR最低(17.040±0.410);Force120kVp组图像噪声最小(2.500±0.000),SNR最高(30.806±1.398)。Force组图像SNR均高于IQon组。IQon140kVp组图像的CNR最高(3.325±0.300),但CNR在各组图像间差异无统计学意义。
组内比较方面,Force两组图像噪声差异具有统计学意义,但SNR和CNR差异均无统计学意义;IQon两组图像之间噪声、SNR及CNR之间差异均无统计学意义(具体结果见表1)。
表 1 四组图像噪声参数组间对比Table 1. Comparison of image noise parameters among the four groups噪声参数 Force120kVp Force140kVp IQon120kVp IQon140kVp $F $ $P $ SD 2.500±0.000 2.833±0.289 3.400±0.050 2.783±0.351 8.153 0.008 SNR 30.806±1.398 29.472±4.427 17.040±0.410 23.844±2.823 15.905 0.001 CNR 2.778±0.241 2.556±0.419 2.604±0.208 3.325±0.300 4.065 0.050 2.3 四组图像一致性评价
两名医师对各组图像的主观指标的一致性评价良好,均为0.750,差异具有统计学意义;同样,两人对各组图像的客观噪声参数一致性较好(0.630~0.857),差异均具有统计学意义,具体结果见表2。
表 2 两名放射科医师的一致性分析结果Table 2. Reliability analysis between the two radiologists主客观指标 一致性指数 P 主客观指标 一致性指数 P 高对比度分辨率1 0.750 0.007 CTm2 0.857 0.000 低对比度分辨率1 0.750 0.007 CTw2 0.768 0.004 噪声2 0.630 0.028 注:1-使用Cohen's Kappa检验;2-使用Spearman相关性分析。 3. 讨论
在CT临床应用日益普及和快速增长的情况下,如何在达到诊断标准要求的图像质量的基础上进一步降低辐射剂量是目前努力的主要方向。辐射剂量可能受扫描次数、管电压、管电流、旋转时间、螺距及患者体型等多因素的影响。降低辐射剂量的常用手段包括管电流调节、自动管电压选择及图像重建优化算法等,但这些技术目前主要应用在头、胸部CT扫描方面,其他部位的研究很多还处在探索阶段[13]。不同研究表明,管电压在同等扫描条件下相比其他扫描参数对图像质量和剂量的影响更为显著[14-16]。
对于拥有多CT机型的医疗机构来说,由于辐射和伦理的问题,很难对同一个患者进行重复扫描,这样,由CT机器或患者本身导致的图像差异便无法验证。体模研究在这种情况下就显得尤为重要。在相同的剂量条件下,不同物质在不同管电压下的衰减系数存在区别;低电压(如80 kVp)其X线光子能量接近43.7 keV,接近碘原子的k-edge临界值(33 keV),因此图像的对比度会升高[17]。
本研究采用固定剂量,每台机器两组管电压的扫描方案,结果显示两台机器120 kVp图像的高对比度分辨率均略好于140 kVp的图像,但4组图像的低对比度分辨率相同,说明120 kVp的图像相较于140 kVp空间分辨率更高,能显示更多细节,但是软组织分辨率相近。客观指标图像噪声参数部分,两台机器之间的差异较为明显,尤其对于西门子Force来说,120 kVp图像的3个噪声参数均好于140 kVp图像。而飞利浦IQon的140 kVp图像略均好于120 kVp图像,这可能是由于IQon光谱CT在以上两种管电压下可以同时实行单能和双能扫描,双层探测器结构加上与之相对应的物质分离算法使得高能量图像具有更广的物质分离光谱,图像质量有一定提升,这与Wellenberg等[18]的发现相类似。值得注意的是,虽然本研究中两者噪声有区别,但差异无统计学意义。
由于厂商对机器校准和算法的区别,要求采用同一套扫描标准以达到相同的图像质量仍较为困难。因此,因地制宜地针对不同CT机器调整适用于影像诊断要求图像质量的扫描参数显得尤为重要。
本研究不足,①两台机型的 CT扫描参数较单一,并未使用低电压低剂量扫描作对比,加上是体模研究,其临床适用性还需进一步验证;②迭代重建算法可能是本研究一个潜在影响因素,特别是本研究中Force使用了全模迭代算法ADMIRE,而IQon使用的是部分迭代算法iDose4;③不同厂商迭代重建算法对图像质量的影响还需要进一步研究。
4. 结论
综上所述,相同条件下,不同厂商不同机型之间图像质量存在差异;两台机器120 kVp图像的高对比度分辨率好于140 kVp图像;Force120kVp的图像噪声值低于其140 kV图像,而IQon两组图像的噪声参数无显著区别。
-
![]()
图 1 Force140 kVp图像的Catphan 500体模CTP 528高对比度分辨率和CTP 515低对比度分辨率测量
Figure 1. Measurement of CTP 528 high contrast resolution and CTP 515 low contrast resolution of Catphan 500 phantom of Force 140 kVp image
表 1 四组图像噪声参数组间对比
Table 1 Comparison of image noise parameters among the four groups
噪声参数 Force120kVp Force140kVp IQon120kVp IQon140kVp $F $ $P $ SD 2.500±0.000 2.833±0.289 3.400±0.050 2.783±0.351 8.153 0.008 SNR 30.806±1.398 29.472±4.427 17.040±0.410 23.844±2.823 15.905 0.001 CNR 2.778±0.241 2.556±0.419 2.604±0.208 3.325±0.300 4.065 0.050  下载: 导出CSV
表 2 两名放射科医师的一致性分析结果
Table 2 Reliability analysis between the two radiologists
主客观指标 一致性指数 P 主客观指标 一致性指数 P 高对比度分辨率1 0.750 0.007 CTm2 0.857 0.000 低对比度分辨率1 0.750 0.007 CTw2 0.768 0.004 噪声2 0.630 0.028 注:1-使用Cohen's Kappa检验;2-使用Spearman相关性分析。
下载: 导出CSV
-
[1] HRICAK H, BRENNER D J, ADELSTEIN S J, et al. Managing radiation use in medical imaging: A multifaceted challenge[J]. Radiology, 2011, 258(3): 889−905. doi: 10.1148/radiol.10101157
[2] SCHLAPPER G. Advances in radiation protection in medicine[J]. Nuclear Technology, 1982, 59(3): 541−542. doi: 10.13182/NT82-A33013
[3] SMITH-BINDMAN R, LIPSON J, MARCUS R, et al. Radiation dose associated with common computed tomography examinations and the associated lifetime attributable risk of cancer[J]. Archives of Internal Medicine, 2009, 169(22): 2078−2086. doi: 10.1001/archinternmed.2009.427
[4] MATHEWS J D, FORSYTHE A V, BRADY Z, et al. Cancer risk in 680000 people exposed to computed tomography scans in childhood or adolescence: Data linkage study of 11 million Australians[J]. British Medical Journal, 2013, 346: f2360. doi: 10.1136/bmj.f2360
[5] PEARCE M S, SALOTTI J A, LITTLE M P, et al. Radiation exposure from CT scans in childhood and subsequent risk of leukaemia and brain tumours: A retrospective cohort study[J]. Lancet, 2012, 380(9840): 499−505. doi: 10.1016/S0140-6736(12)60815-0
[6] de GONZALEZ A B, DARBY S. Risk of cancer from diagnostic X-rays: Estimates for the UK and 14 other countries[J]. Lancet, 2004, 363(9406): 345−351. doi: 10.1016/S0140-6736(04)15433-0
[7] 余滔, 单华, 姜文雯. 低剂量对比剂联合低监测阈值在头颈部CTA中的应用[J]. CT理论与应用研究, 2019,28(4): 455−461. DOI: 10.15953/j.1004-4140.2019.28.04.06. YU T, SHAN H, JIANG W W. Application of low-dose contrast agent combined with low monitoring threshold in head and neck CTA[J]. CT Theory and Applications, 2019, 28(4): 455−461. DOI: 10.15953/j.1004-4140.2019.28.04.06. (in Chinese).
[8] 刘进, 赵倩隆, 尹相瑞, 等. 基于特征学习的低剂量CT成像算法研究进展[J]. CT理论与应用研究, 2019,28(3): 393−406. DOI: 10.15953/j.1004-4140.2019.28.03.14. LIU J, ZHAO Q L, YIN X R, et al. Research progress of low-dose CT imaging algorithms based on feature learning[J]. CT Theory and Applications, 2019, 28(3): 393−406. DOI: 10.15953/j.1004-4140.2019.28.03.14. (in Chinese).
[9] LI B, POMERLEAU M, GUPTA A, et al. Accuracy of dual-energy CT virtual unenhanced and. material-specific images: A phantom study[J]. American Journal of Roentgenology, 2020, 215(5): 1146−1154. doi: 10.2214/AJR.19.22372
[10] BAERENDS E, OOSTVEEN L J, SMIT C T, et al. Comparing dual energy CT and subtraction CT on a phantom: Which one provides the best contrast in iodine maps for sub-centimetre details?[J]. European Radiology, 2018, 28(12): 5051−5059. doi: 10.1007/s00330-018-5496-x
[11] EULER A, SOLOMON J, MAZUROWSKI M A, et al. How accurate and precise are CT based measurements of iodine concentration? A comparison of the minimum detectable concentration difference among single source and dual source dual energy CT in a phantom study[J]. European Radiology, 2019, 29(4): 2069−2078. doi: 10.1007/s00330-018-5736-0
[12] LENNARTZ S, PARAKH A, CAO J, et al. Inter-scan and inter-scanner variation of quantitative dual-energy CT: Evaluation with three different scanner types[J]. European Radiology, 2021, 31(7): 4438−4451. doi: 10.1007/s00330-020-07611-0
[13] MASJEDI H, ZARE M H, SIAHPOUSH N K, et al. European trends in radiology: Investigating factors affecting the number of examinations and the effective dose[J]. La Radiologia Medica, 2019, 125(3): 296−305.
[14] 雷勇, 陈自谦, 钱根年, 等. MSCT参数优化和图像质量的相关性研究[J]. 中国医疗设备, 2014,29(1): 32−35. doi: 10.3969/j.issn.1674-1633.2014.01.008 LEI Y, CHEN Z Q, QIAN G N, et al. Research on the correlation between MSCT parameter optimization and image quality[J]. China Medical Equipment, 2014, 29(1): 32−35. (in Chinese). doi: 10.3969/j.issn.1674-1633.2014.01.008
[15] 杜云, 吴琼. 不同管电压对头颈CTA图像质量及辐射剂量的影响分析[J]. 影像研究与医学应用, 2021,5(12): 140−141. doi: 10.3969/j.issn.2096-3807.2021.12.069 DU Y, WU Q. Analysis of the influence of different tube voltages on the image quality and radiation dose of head and neck CTA[J]. Image Research and Medical Applications, 2021, 5(12): 140−141. (in Chinese). doi: 10.3969/j.issn.2096-3807.2021.12.069
[16] 隋岩, 杨德武. CT对胸部体模内病灶的检出率: 不同扫描条件的对比研究[J]. 放射学实践, 2020,35(4): 552−554. SUI Y, YANG D W. CT detection rate of lesions in the chest phantom: A comparative study of different scanning conditions[J]. Radiology Practice, 2020, 35(4): 552−554. (in Chinese).
[17] 王贤坤, 邹才盛. 不同管电压对头颈CTA图像质量及辐射剂量的影响分析[J]. 影像研究与医学应用, 2019,3(5): 21−23. doi: 10.3969/j.issn.2096-3807.2019.05.012 WANG X K, ZOU C S. Analysis of the influence of different tube voltages on the image quality and radiation dose of head and neck CTA[J]. Image Research and Medical Applications, 2019, 3(5): 21−23. (in Chinese). doi: 10.3969/j.issn.2096-3807.2019.05.012
[18] WELLENBERG R H, BOOMSMA M F, van OSCH J A, et al. Quantifying metal artifact reduction using virtual monochromatic dual-layer detector spectral CT imaging in unilateral and bilateral total hip prostheses[J]. European Journal Radiology, 2017, 88: 61−70. doi: 10.1016/j.ejrad.2017.01.002
-
期刊类型引用(3)
1. 刘雨欣,陈凡秀,孙洁,王远,王潇,于洋,顾焱吉. 管电压管电流和开机时间对CT图像质量的影响. 实验力学. 2024(01): 17-26 .  百度学术
百度学术
2. 朱丽娟,马瑞,沈云,汪芳,杨彦兵,曹永佩,杨利莉,吴小红. 探讨不同管电压下DLIR重建算法对冠状动脉CTA图像质量的影响. 宁夏医学杂志. 2023(09): 787-791+865 . 百度学术
3. 王振宇,黄蕾. 分析CT图像的质量控制与设备维护保养. 中国设备工程. 2023(18): 85-87 . 百度学术
其他类型引用(0)
计量
- 文章访问数: 456
- HTML全文浏览量: 131
- PDF下载量: 41
- 被引次数: 3


