
Correlation between Emphysema Volume and Small Shadow Density on CT and the Lung Function in Pneumoconiosis
-
摘要: 目的:比较尘肺患者肺气肿程度及肺部小阴影对肺功能的影响。方法:选择2015年至2020年间十堰市太和医院收治的明确诊断尘肺且合并肺气肿的患者96名,进行胸部CT检查及肺功能测定;采用64排螺旋CT(GE Optima CT 680)进行三维容量测量系统定量分析全肺、左右肺、各肺上中下肺野低衰减区容积百分比(LAV%),并根据全肺LAV% 将其分为A组:LAV%<15%,B组:LAV%15%~30%,C组:LAV%>30% 三组,分析肺气肿分布特点及与肺功能的相关性;将胸片评定小阴影密集度的标准应用于CT中得出CT图像的全肺、左右肺、上中下肺野小阴影密集度(SSD),并分析与肺功能的相关性。结果:全肺SSD与FEV1、TLC、PEF、MEF75%、MEF25% 呈负相关,与RV/TLC呈正相关;全肺、左肺、右肺、及上中下肺野LAV% 与FEV1、FEV1%、DLCO、PEF、MEF75%、MEF50%、MEF25% 呈负相关,与RV、RV/TLC% 呈正相关;当LAV%>30% 时,即C组LAV% 与肺功能FEV1、FEV1%、DLCO、RV/TLC、PEF、MEF75%、MEF50%、MEF25% 间的相关性较A组和B组好;肺部小阴影密集度与肺通气功能、容积参数有一定相关性,但与弥散功能相关性较弱。结论:尘肺患者肺气肿程度及小阴影密集度与肺功能均有一定相关性,但肺气肿较小阴影密集度与肺功能相关性更好,且能在一定程度上评估尘肺患者肺损伤程度,值得临床推广应用。Abstract: Objective: To compare the influence of emphysema and lung small shadow on the lung function of patients with pneumoconiosis. Methods: We selected 96 patients who were admitted to the Taihe Hospital (Shiyan city) for pneumoconiosis complicated by emphysema between 2015 and 2020. Chest computed tomography (CT) and lung function assessments were performed. The low attenuation volumes (LAV%) of the whole lung; left and right lungs; and upper, middle, and lower lobes of each lung were quantified using 64-slice spiral CT (GE Optima CT680). Based on the LAV% of the whole lung, the patients were divided into groups A (LAV%<15%), B (LAV%: 15%–30%), and C (LAV% >30%). The small shadow density (SSD) of the whole lung; left and right lungs; and upper, middle, and lower lung fields was calculated by applying the criteria for evaluating SSD on chest radiographs to CT images. The correlation between SSD and lung function was also analyzed. Results: The SSD of the whole lung was negatively correlated with the forced expiratory volume in the first second (FEV1), total lung capacity (TLC), peak expiratory flow (PEF), maximum expiratory flow after 75% of the forced vital capacity (FVC) has not been exhaled (MEF75%), and maximum expiratory flow after 25% of the FVC has not been exhaled (MEF25%), and it was positively correlated with residual volume (RV)/TLC. LAV% was negatively correlated with FEV1, ratio of FEV to FEV1 (FEV1%), carbon monoxide diffusion capacity (DLCO), PEF, MEF75%, maximum expiratory flow after 50% of the FVC has not been exhaled (MEF50%), and MEF25% in the whole lung; left and right lungs; and upper, middle, and lower lung lobes; however, it was positively correlated with RV and RV/TLC%. When LAV% was >30%, the correlation between LAV% and FEV1, FEV1%, DLCO, RV/TLC, PEF, MEF75%, MEF50%, and MEF25% was stronger in group C than in groups A and B. A certain degree of correlation was observed between the SSD in the lungs and the ventilation function and volume parameters; however, the correlation between SSD and the diffusion function was weak. Conclusion: The degree of emphysema and SSD in patients with pneumoconiosis have a certain degree of correlation with the lung function; however, the SSD of emphysema has a relatively better correlation with the lung function. It can be used to evaluate the degree of lung injury in patients with pneumoconiosis to a certain extent and is worthy of clinical application.
-
Keywords:
- CT /
- pneumoconiosis /
- emphysema /
- lung function
-
尘肺病是我国危害严重的一类职业病,诊断和分期主要依靠高仟伏胸片,在临床诊断中需要X胸片和CT结合[1],CT在尘肺病的早期诊断、肺气肿分布范围和大小以及小阴影类型和密集度等检出率明显优于高仟伏X线胸片[2]。肺功能检查用于检测呼吸道的通畅程度、肺容量的大小及气体交换能力已作为评估尘肺病患者的肺功能的“金标准”[3]。
目前已有研究表明肺气肿程度与通气及弥散功能相关指标呈负相关;小阴影密集度越高及分布肺区越多,患者肺功能越差[4-5],但两者与肺功能之间的相关性对比暂无研究,因此本文研究尘肺患者合并不同程度肺气肿及小阴影密集度与肺功能的相关性。
1. 对象与方法
在关于慢性阻塞性肺疾病(chronic obstructive pulmonary disease,COPD)合并肺气肿与肺功能的影响研究中,将CT值<-950 HU定义为低密度衰减容量(low attenuation volume,LAV)[6],以低密度衰减区占肺容积的百分比(LAV%)作为评估尘肺患者肺气肿的严重程度。
张雨洁等[7]将LAV%=15% 作为轻度及重度肺气肿的界限,而Frith等[8]研究提出当肺组织损伤大于30% 肺功能才表现异常,因此本研究参考这两项研究,96名患者分为A组:LAV%<15%,B组:LAV%>15% 且<30%;C组:LAV%>30%。
1.1 研究对象
选择2015至2020年间我院收治已确诊尘肺(符合GBZ 70-2015《职业性尘肺病的诊断》标准)的患者96例,年龄25~81岁,平均年龄(42.37+6.51)岁,接触粉尘的时间2~35年。
纳入标准:患者病情稳定,非感染期,剔除存在肺结核、支气管扩张、重症肺炎、胸腔积液、肺部肿瘤或占位性病变、胸部外伤畸形、气胸和胸膜病变等肺部并发症等。患者均进行胸部CT检查和肺功能检查且要统一检查设备。
1.2 方法
1.2.1 CT检查
采用64排螺旋CT(GE Optima CT 680)进行薄层扫描,每个层面清晰显示支气管及肺纹理,组织间对比良好。扫描参数:管电压120 kV,自动毫安(50~100 mA),层厚0.625 mm×64,螺距1.375︰1。深吸气末屏气扫描,扫描后肺窗由lung算法显示。
1.2.2 肺功能测定
采用肺功能测定仪(Type Master Screen-Body/Dift)进行肺功能测定,严格执行质量控制标准,确保用力肺活量外推容积<5% 或<150 mL,呼气时间≥6 s,曲线起始无犹豫,PEF尖峰迅速出现,呼气无中断,无咳嗽,曲线平滑,流量环闭合。
弥散、残气检测采用一口气法,执行国际标准(ATS/ERS),憋气时间10 s,肺功能测量值包括第1 s用力呼气容积(forced expiratory volume in the first second,FEV1)、第1 s用力呼气量占用力肺活量比值(ratio of forced expiratory volume to forced vital capacity in the first second,FEV1%)、用力肺活量(forced vital capacity,FVC)、一氧化碳弥散量(carbon monoxide diffusion capacity,DLCO)、功能残气量(residual volume,RV)、肺总量(total lung capacity,TLC)、残气量与肺总量的比值(residual volume/Total lung capacity,RV/TLC)、呼气峰值流速(peak expiratory flow,PEF)、75% 肺活量时的最大呼气流速(maximum expiratory flow after 75% of the FVC has not been exhaled,MEF75%)、50% 肺活量时的最大呼气流速(maximum expiratory flow after 50% of the FVC has not been exhaled,MEF50%)和25% 肺活量时的最大呼气流速(maximum expiratory flow after 25% of the FVC has not been exhaled,MEF25%)。
1.2.3 LAV%
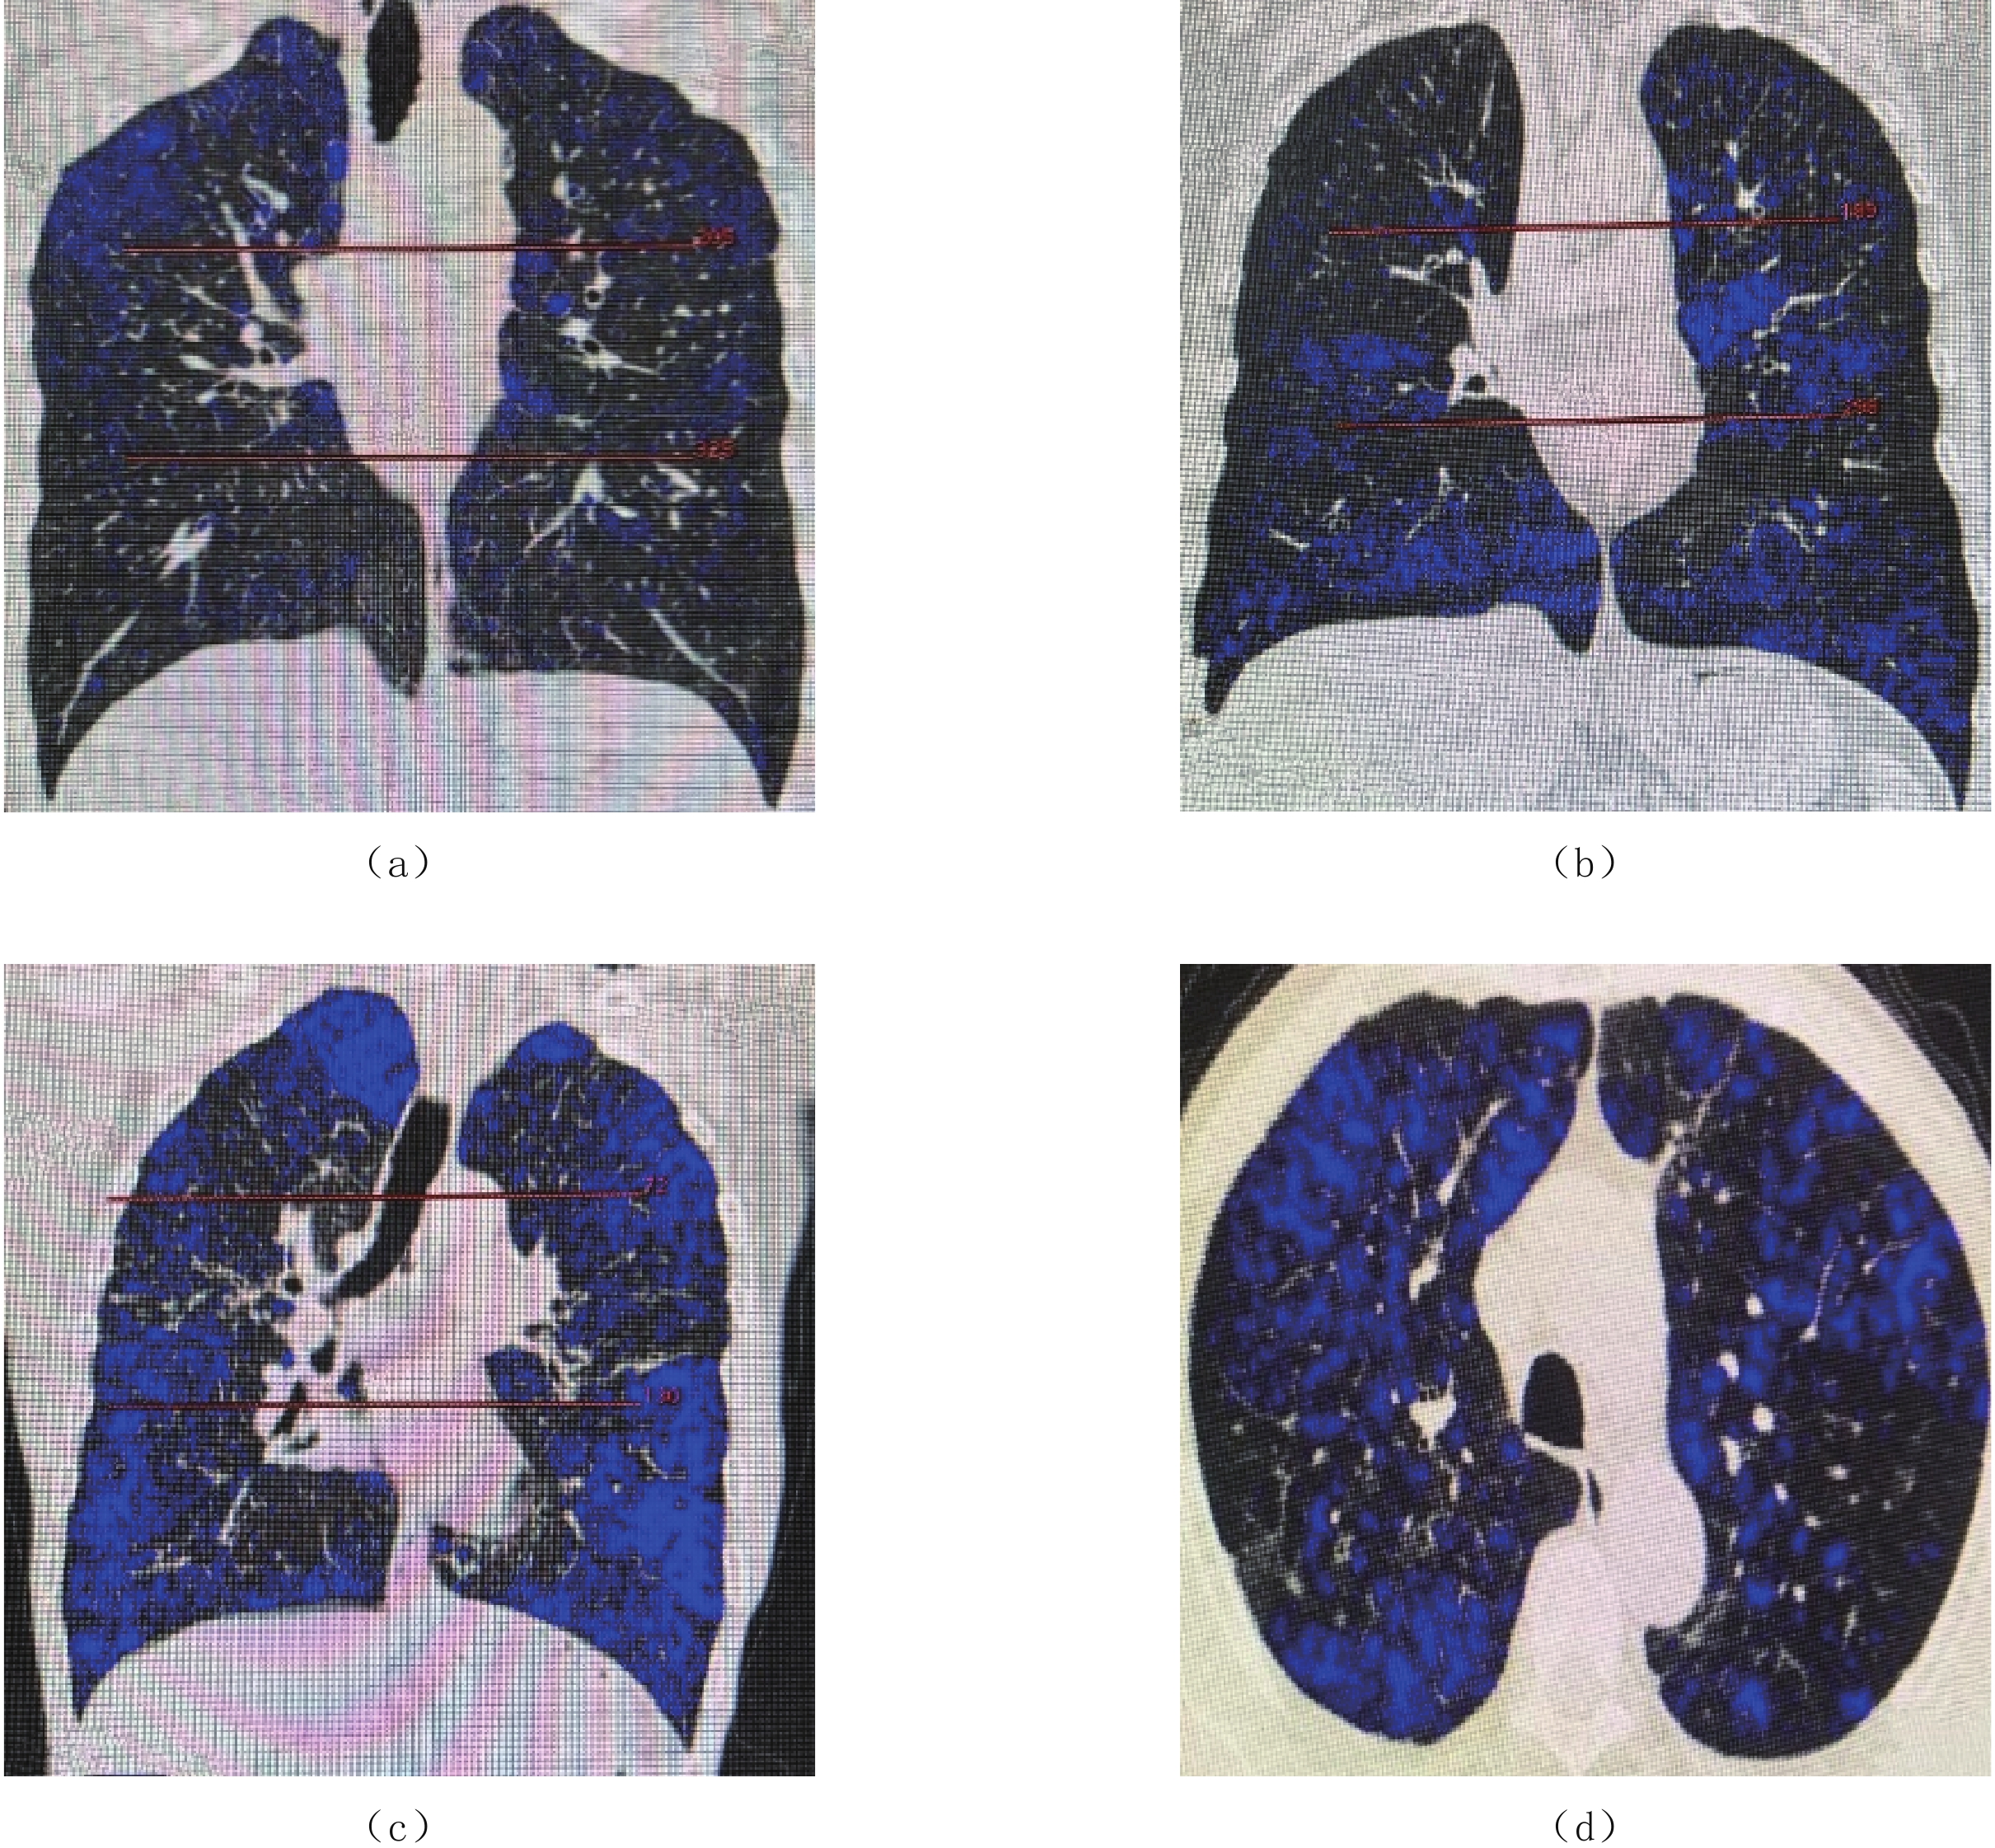
采用GE AW 4.6工作站及特定分析软件将深吸气末0.625 mm层厚的图像进行后处理,设定肺气肿的测量阈值为<-950 HU[6],肺部CT图像由气管纵向水平的冠状面上用等分点的水平线将左右肺各分为上、中、下3个肺野,取得全肺、左右肺及各个肺野低密度衰减区占肺容积百分比(low attenuation volume,LAV%)(图1),其中A组42名,B组29名,C组25名。同一患者肺部三维图像经后处理软件分析后得到的各肺野LAV%(表1)。
![]() 图 1 分别为A、B、C组部分尘肺患者肺部CT冠状位图像及轴位图像,冠状位图像由气管纵向水平上用等分点的水平线将左右肺各分为上、中、下3个肺野,蓝色区域为肺气肿低衰减区三维图像Figure 1. Coronal and axial CT images of some patients with pneumoconiosis in groups A, B, and C. The left and right lungs were divided into upper, middle, and lower lung fields from the vertical level of the trachea using equidistant horizontal lines; blue areas present emphysema as three-dimensional images of low-attenuation areas表 1 各肺野LAV% 数据表Table 1. LAV% data for each lung field
图 1 分别为A、B、C组部分尘肺患者肺部CT冠状位图像及轴位图像,冠状位图像由气管纵向水平上用等分点的水平线将左右肺各分为上、中、下3个肺野,蓝色区域为肺气肿低衰减区三维图像Figure 1. Coronal and axial CT images of some patients with pneumoconiosis in groups A, B, and C. The left and right lungs were divided into upper, middle, and lower lung fields from the vertical level of the trachea using equidistant horizontal lines; blue areas present emphysema as three-dimensional images of low-attenuation areas表 1 各肺野LAV% 数据表Table 1. LAV% data for each lung field数据范围 右肺 左肺 右肺 上野 中野 下野 左肺 上野 中野 下野 -1024~-950/% 24.030 24.120 22.428 25.237 23.080 23.053 19.105 26.269 -950~3071/% 75.970 75.881 77.572 74.763 76.920 76.947 80.895 73.731 Total/L 4.300 0.984 1.456 1.860 3.384 0.843 1.128 1.413 1.2.4 小阴影密集度
由3位有尘肺病诊断资格的影像科医师进行阅片,肺部CT图像由气管纵向水平的冠状面上用等分点的水平线将左右肺各分为上、中、下3个肺野,取得CT图像的全肺、左右肺及各个肺野的小阴影密集度(small shadow density,SSD),其中SSD的评分方法参考GBZ 70-2015《职业性尘肺病诊断》[9]及翟荣存等[10]胸片密集度分级方法应用于CT,将SSD分为0、1、2和3级4个等级。
1.2.5 统计学方法
使用SPSS 23.0软件包,非正态肺部计量资料M(Q25,Q75)表示,组间比较采用2个独立样本非参数检验,LAV%、SSD与肺功能的相关性采用Spearman相关分析或Pearson相关性分析,以P<0.05为差异有统计学意义。
2. 结果
2.1 各肺及肺野SSD、LAV% 间的比较
对96名尘肺患者左右肺、左右肺上、中、下肺野及上、中、下3个肺野间SSD、LAV% 进行组间两两对比,其中左右肺、左右肺上、中、下肺野SSD组间差异无统计学意义;左右肺3个肺野间SSD进行组间对比差异有统计学意义;A、B、C三组组间全肺总体SSD间对比差异均无统计学意义(表2)。
表 2 A、B、C组组间总体SSD间差异性分析Table 2. Comparison of the total SSD among groups A, B, and C项目 SSD A B B C A C M(Q25,Q75) 2(1,3) 2(2,3) 2(2,3) 2(1,3) 2(1,3) 2(1,3) Z -0.454 -0.373 -0.537 P 0.650 0.767 0.591 注:M(Q25,Q75)为A、B、C三组总体小阴影密集度中位数及四分位数,组间对比不符合正态分布采用非参数检验得到P>0.05,
3组总体小阴影密集度对比差异无统计学意义。2.2 SSD与肺功能的相关性
全肺SSD与FEV1、TLC、PEF、MEF75%、MEF25%呈负相关,与RV/TLC呈正相关(r=-0.248、-0.244、-0.268、-0.217、-0.246、0.219)。右上中、左中下肺野SSD与FVC呈负相关(r=-0.209、-0.294、-0.258、-0.278);右下肺野SSD与FVC、TLC、PEF、MEF25%呈负相关(r=-0.291、-0.232、-0.209、-0.213);左上肺野SSD与RV/TLC呈正相关(r=0.204)。
A组全肺、右上中、左上、B组总体、右上中下肺野、左上中下肺野、C组全肺、右上、左上SSD与肺功能各指标间无相关性,A组右下肺野、左中肺野SSD与FEV1、FVC呈负相关(r=-0.330、-0.388、-0.317、-0.501),A组左下肺野SSD与FVC呈负相关(r=-0.385);C组左右肺中下肺野SSD均与DLCO呈正相关(r=0.511、0.420、0.492、0.648);C组左下肺野SSD与RV呈负相关(r=-0.563)(表3~表5)。
表 3 A组各肺野SSD、LAV% 与肺功能指标的相关性分析Table 3. Analysis of correlation between SSD and LAV% of the lung field and lung function indexes in group AA组 右上 右中 右下 左上 左中 左下 SSD LAV% SSD LAV% SSD LAV% SSD LAV% SSD LAV% SSD LAV% FEV1 -0.099 0.019 -0.157 -0.093 -0.330* -0.073 -0.228 0.132 -0.317* -0.203 -0.172 0.065 FEV1% 0.159 -0.068 0.037 0.060 -0.124 -0.159 -0.037 0.005 -0.085 -0.337* -0.076 0.082 FVC -0.258 0.020 -0.374* -0.034 -0.388* -0.047 -0.296 0.084 -0.501** -0.231 -0.385* 0.123 DLCO 0.035 -0.022 -0.007 -0.055 0.053 0.119 -0.077 -0.091 0.011 -0.233 -0.079 0.268 RV -0.079 0.192 -0.124 -0.048 0.027 0.070 -0.036 0.194 -0.082 0.082 -0.019 -0.060 TLC -0.004 0.256 -0.030 -0.030 -0.152 0.080 -0.010 0.386* -0.082 0.262 -0.002 0.008 RV/TLC 0.140 0.089 0.058 -0.199 0.187 -0.162 0.176 -0.025 0.164 0.179 0.171 -0.148 PEF 0.020 -0.034 -0.144 -0.145 -0.267 -0.083 -0.091 0.134 -0.250 -0.253 -0.122 0.057 MEF75% -0.055 -0.059 -0.055 -0.127 -0.262 -0.250 -0.061 0.048 -0.225 -0.322* -0.106 0.097 MEF50% -0.057 -0.018 -0.057 -0.032 -0.249 -0.189 -0.110 0.048 -0.213 -0.310* -0.165 0.114 MEF25% -0.116 0.040 -0.116 0.218 -0.251 0.107 -0.095 0.121 -0.227 -0.253 -0.286 0.106 注:* 为P<0.05,**为P<0.01。 表 4 B组各肺野SSD、LAV% 与肺功能指标的相关性分析Table 4. Analysis of correlation between SSD and LAV% of the lung field and lung function indexes in group BB组 右上 右中 右下 左上 左中 左下 SSD LAV% SSD LAV% SSD LAV% SSD LAV% SSD LAV% SSD LAV% FEV1 -0.053 0.247 -0.149 -0.036 -0.096 -0.314 -0.123 0.102 -0.009 -0.211 -0.080 -0.521* FEV1% -0.024 0.314 -0.190 0.025 -0.075 -0.304 -0.074 0.128 -0.104 -0.133 -0.147 -0.615* FVC -0.179 -0.078 -0.263 -0.177 -0.079 -0.133 -0.209 -0.038 -0.009 -0.111 -0.161 -0.407* DLCO 0.062 0.157 -0.365 -0.269 -0.154 0.020 0.041 -0.025 0.239 -0.227 -0.288 -0.224 RV -0.170 -0.095 -0.024 -0.112 0.048 0.035 -0.227 -0.025 -0.069 -0.138 0.009 0.009 TLC -0.149 0.155 -0.056 -0.020 -0.268 -0.270 -0.219 0.196 0.147 -0.038 -0.041 -0.113 RV/TLC 0.170 -0.092 0.187 -0.179 0.191 0.450* 0.118 -0.148 0.039 0.051 0.120 0.321 PEF 0.085 0.215 -0.153 -0.015 -0.235 -0.152 -0.044 0.060 0.028 -0.121 -0.140 -0.280 MEF75% 0.072 0.266 -0.055 0.084 -0.002 -0.155 -0.033 0.060 0.021 -0.133 0.013 -0.478* MEF50% 0.048 0.201 -0.067 -0.112 0.015 -0.243 -0.018 0.037 -0.004 -0.259 -0.043 -0.533* MEF25% -0.152 0.199 -0.214 0.024 -0.162 -0.180 -0.238 0.012 -0.176 -0.201 -0.174 -0.479* 注:* 为P<0.05。 表 5 C组各肺野SSD、LAV% 与肺功能指标的相关性分析Table 5. Analysis of correlation between SSD and LAV% of the lung field and lung function indexes in group CC组 右上 右中 右下 左上 左中 左下 SSD LAV% SSD LAV% SSD LAV% SSD LAV% SSD LAV% SSD LAV% FEV1 0.324 -0.453* 0.242 -0.435* -0.126 -0.555* 0.030 -0.575* 0.053 -0.554* 0.149 -0.519* FEV1% 0.302 -0.513* 0.209 -0.420* -0.007 -0.532* 0.076 -0.552* 0.068 -0.581* 0.205 -0.389* FVC -0.138 0.010 -0.181 -0.086 -0.284 -0.205 0.036 -0.137 -0.042 -0.156 -0.102 -0.291 DLCO 0.338 -0.282 0.511* -0.506* 0.420* -0.503* 0.395 -0.326 0.492* -0.523* 0.648* -0.410* RV -0.358 0.065 -0.315 0.221 0.260 0.347 -0.191 0.268 -0.199 0.490* -0.563* 0.325 TLC -0.033 -0.285 0.043 0.085 -0.362 -0.110 -0.248 -0.414* -0.136 -0.203 -0.136 -0.233 RV/TLC 0.150 0.042 0.048 0.130 -0.134 0.211 0.242 0.151 0.197 0.299 0.115 0.332 PEF 0.250 -0.535* 0.069 -0.324 -0.211 -0.469* -0.111 -0.575* -0.069 -0.476* 0.003 -0.530* MEF75% 0.161 -0.498* -0.036 -0.297 -0.266 -0.423* -0.199 -0.529* -0.178 -0.395 -0.053 -0.496* MEF50% 0.136 -0.376 -0.077 -0.229 -0.338 -0.329 -0.201 -0.367 -0.153 -0.286 -0.139 -0.431* MEF25% 0.040 -0.312 -0.031 -0.202 -0.377 -0.298 -0.221 -0.306 -0.114 -0.239 -0.141 -0.404* 注:* 为P<0.05。 2.3 LAV%与肺功能的相关性
右肺上中下肺野、左肺上下及中下肺野LAV% 组间差异有统计学意义,左右肺、左肺上中肺野LAV% 间差异无统计学意义。A、B、C组中各肺野LAV% 间对比差异有统计学意义。
A组左上肺野LAV% 与TLC呈正相关,左中肺野LAV% 与FEV1%、MEF75%、MEF50%呈负相关,左中肺野与FEV1、MEF75%、MEF50% 呈负相关;B组左下肺野LAV% 与FEV1、FEV1%、MEF75%、MEF50%、MEF25% 呈负相关,右下肺野LAV% 与RV/TLC呈正相关;C组左右肺上肺野LAV% 与FEV1、 FEV1%、PEF、MEF75% 呈负相关,左下肺野LAV% 与FEV1、FEV1%、DLCO、PEF、MEF75%、MEF50%、MEF25% 呈负相关,右下肺野LAV% 与FEV1、FEV1%、DLCO、PEF、MEF75% 呈负相关,左中肺野LAV% 与FEV1、FEV1%、DLCO、PEF呈负相关,与RV呈正相关;右中肺野LAV% 与FEV1、FEV1%、DLCO呈负相关(表3~表5)。
3. 讨论
尘肺是一种对社会和患者家庭带来沉重负担及严重威胁患者身体健康的一种职业病。尘肺患者早期多无症状,胸部CT影像学可表现为小阴影、大阴影、肺气肿、胸膜改变及蜂窝状等,且CT征象与肺功能分级呈正相关。由于目前临床有部分尘肺患者影像学肺组织损伤程度较轻,但肺功能测值却严重受损,而部分患者CT影像学阴影明显,肺功能检查却无明显改变,呈现肺功能与阴影影像学改变的不匹配,因此本研究探索比较肺部CT阴影及肺气肿表现对肺功能的影响,以期找出对尘肺患者肺功能损伤高效、适用的评估方法,提高基层对尘肺的认识、指导临床诊疗。
肺气肿是肺部的一种病理状态,主要病理改变为细支气管远端持续气道异常扩大,同时支气管壁不同程度破坏,严重影响患者的生活质量。早期诊断肺气肿对改善尘肺患者预后非常重要。对本研究中96名患者SSD纵向分布对比后发现几乎所有患者肺气肿分布在上肺野居多,中肺野次之,下肺野分布最少,可能与下肺野胸膜腔分压较中上肺野小,此压力梯度造成上肺野气体潴留较多;此外肺血管重塑易发生于上肺的说法也是肺气肿形成的重要原因[11]。
全肺、左右肺及各肺野LAV% 与FEV1、FEV1%、PEF、MEF75%、MEF50%、MEF25% 间均呈负相关,随LAV% 升高,肺功能上述指标呈明显下降趋势,肺通气功能下降,可能与随着肺气肿程度加重,气道壁破坏纤维化更加严重,导致气流受限从而使通气功能下降有关;与RV、RV/TLC呈正相关,即随着LAV% 的升高,肺容积参数增大,与肺气肿时终末细支气管远端过度扩张导致残气量及肺容积增大有关,与既往研究一致[12-13]。
不同肺野组间比较结果显示下肺野LAV% 与FEV1、PEF、MEF75%、MEF50%、MEF25% 等指标相关性均大于上中肺叶,一定程度说明下叶肺气肿对肺通气功能影响更大,考虑与下肺呼吸动度较中上肺大,下肺病变对肺顺应性影响更大有关。C组中除左、右肺上肺野LAV% 与DLCO无相关性外,其余各肺野LAV% 均与DLCO有较强的相关性,96名患者中、下肺野LAV% 与DLCO相关性均大于上肺叶,可能与当肺气肿多分布于上叶时气体交换少,导致通气/血流比例失调,从而不会引起肺弥散功能变化有关,说明中、下肺野与肺弥散功能相关性较高。
综合以上结果提示下叶肺部病变特别是存在肺气肿时更容易导致肺功能指标的变化,从而反映肺损伤的程度,此研究与王雷等[13]、兰长青等[14]研究结果部分一致。
本研究中A组仅左中肺野LAV% 与FEV1%、MEF75%、MEF50% 有弱负相关性,表明当LAV%<15% 时,肺气肿与肺功能之间的相关性较小,说明多层螺旋CT及后处理技术较肺功能更早的发现肺气肿,并能快速对肺气肿进行定位定量分析[15]。B组中仅左下肺野LAV%与FEV1、FEV1%、MEF75%、MEF50%、MEF25% 呈负相关,右下肺野与RV/TLC呈正相关,表明下肺野肺气肿较上中肺野更早反映肺功能变化及肺组织损伤程度。
与X线相比,CT扫描所见阴影要比X线平片显示范围广,尤其对纵隔和心影后的特殊部位的小阴影显示更有优势。也有研究表明CT与X线胸片对总体小阴影密集度的判定存在高度一致,但对于上、下肺野的病变显示多于X线胸片,右中肺野病变显示少于X线胸片,考虑与上、下肺野体积所占总体积比例小,病变数量相对较少,CT在横断面更能清楚显示小阴影数量,导致CT对小阴影密集度判定比X线胸片更准确;右中肺野因与右侧胸大肌重叠导致小阴影密集度增高[16]。
本研究96名患者上肺野SSD值普遍较中下肺野SSD值大,小阴影多分布于上肺野,可能与上肺及肺的后部淋巴引流缓慢使粉尘清除能力较弱粉尘沉积有关[17-18]。全肺总体SSD与FEV1、PEF、MEF75%、MEF25% 呈负相关,与RV/TLC呈正相关,说明随着肺部小阴影密集度的升高,会逐渐引起肺通气功能下降,且可能合并小气道的病变,与粉尘滞留在肺泡与支气管内不断被巨噬细胞吞噬、释放,反复炎性渗出导致肺小血管、肺泡间隔等纤维化引起肺通气功能下降。
在A、B、C三组中仅A组右下肺野、左中肺野与FEV1、FVC呈弱负相关性,A组左下肺野SSD与FVC呈负相关,C组右中肺野、左中下肺野SSD与DLCO呈正相关,研究结果表明当LAV%<30%时小阴影密集度对肺功能影响较小,即使CT表现为弥漫性小阴影,但肺功能仍可无明显异常;仅当LAV>30% 时,小阴影密集度与弥散功能有一定相关性。C组小阴影密集度、肺气肿与肺功能间相关性均较A组和B组强,表明当LAV%>30% 时,肺通气功能会受到严重损伤超过肺组织代偿能力后出现肺功能指标异常。
综上所述,CT定量分析评价肺气肿是可行的,LAV% 与FEV1、FEV1%、DLCO、PEF、MEF75%、MEF50%、MEF25% 呈负相关,LAV% 与肺功能的相关性较SSD强,LAV% 一定程度上可反映尘肺患者肺损伤程度,且肺气肿比小阴影密集度与肺功能相关性更好,结合CT影像检查能够更精准的诊断尘肺病,评估肺损伤程度,并在尘肺病的临床诊断与治疗评估上也有重要的指导价值。
-
![]()
图 1 分别为A、B、C组部分尘肺患者肺部CT冠状位图像及轴位图像,冠状位图像由气管纵向水平上用等分点的水平线将左右肺各分为上、中、下3个肺野,蓝色区域为肺气肿低衰减区三维图像
Figure 1. Coronal and axial CT images of some patients with pneumoconiosis in groups A, B, and C. The left and right lungs were divided into upper, middle, and lower lung fields from the vertical level of the trachea using equidistant horizontal lines; blue areas present emphysema as three-dimensional images of low-attenuation areas
表 1 各肺野LAV% 数据表
Table 1 LAV% data for each lung field
数据范围 右肺 左肺 右肺 上野 中野 下野 左肺 上野 中野 下野 -1024~-950/% 24.030 24.120 22.428 25.237 23.080 23.053 19.105 26.269 -950~3071/% 75.970 75.881 77.572 74.763 76.920 76.947 80.895 73.731 Total/L 4.300 0.984 1.456 1.860 3.384 0.843 1.128 1.413  下载: 导出CSV
表 2 A、B、C组组间总体SSD间差异性分析
Table 2 Comparison of the total SSD among groups A, B, and C
项目 SSD A B B C A C M(Q25,Q75) 2(1,3) 2(2,3) 2(2,3) 2(1,3) 2(1,3) 2(1,3) Z -0.454 -0.373 -0.537 P 0.650 0.767 0.591 注:M(Q25,Q75)为A、B、C三组总体小阴影密集度中位数及四分位数,组间对比不符合正态分布采用非参数检验得到P>0.05,
3组总体小阴影密集度对比差异无统计学意义。
下载: 导出CSV
表 3 A组各肺野SSD、LAV% 与肺功能指标的相关性分析
Table 3 Analysis of correlation between SSD and LAV% of the lung field and lung function indexes in group A
A组 右上 右中 右下 左上 左中 左下 SSD LAV% SSD LAV% SSD LAV% SSD LAV% SSD LAV% SSD LAV% FEV1 -0.099 0.019 -0.157 -0.093 -0.330* -0.073 -0.228 0.132 -0.317* -0.203 -0.172 0.065 FEV1% 0.159 -0.068 0.037 0.060 -0.124 -0.159 -0.037 0.005 -0.085 -0.337* -0.076 0.082 FVC -0.258 0.020 -0.374* -0.034 -0.388* -0.047 -0.296 0.084 -0.501** -0.231 -0.385* 0.123 DLCO 0.035 -0.022 -0.007 -0.055 0.053 0.119 -0.077 -0.091 0.011 -0.233 -0.079 0.268 RV -0.079 0.192 -0.124 -0.048 0.027 0.070 -0.036 0.194 -0.082 0.082 -0.019 -0.060 TLC -0.004 0.256 -0.030 -0.030 -0.152 0.080 -0.010 0.386* -0.082 0.262 -0.002 0.008 RV/TLC 0.140 0.089 0.058 -0.199 0.187 -0.162 0.176 -0.025 0.164 0.179 0.171 -0.148 PEF 0.020 -0.034 -0.144 -0.145 -0.267 -0.083 -0.091 0.134 -0.250 -0.253 -0.122 0.057 MEF75% -0.055 -0.059 -0.055 -0.127 -0.262 -0.250 -0.061 0.048 -0.225 -0.322* -0.106 0.097 MEF50% -0.057 -0.018 -0.057 -0.032 -0.249 -0.189 -0.110 0.048 -0.213 -0.310* -0.165 0.114 MEF25% -0.116 0.040 -0.116 0.218 -0.251 0.107 -0.095 0.121 -0.227 -0.253 -0.286 0.106 注:* 为P<0.05,**为P<0.01。
下载: 导出CSV
表 4 B组各肺野SSD、LAV% 与肺功能指标的相关性分析
Table 4 Analysis of correlation between SSD and LAV% of the lung field and lung function indexes in group B
B组 右上 右中 右下 左上 左中 左下 SSD LAV% SSD LAV% SSD LAV% SSD LAV% SSD LAV% SSD LAV% FEV1 -0.053 0.247 -0.149 -0.036 -0.096 -0.314 -0.123 0.102 -0.009 -0.211 -0.080 -0.521* FEV1% -0.024 0.314 -0.190 0.025 -0.075 -0.304 -0.074 0.128 -0.104 -0.133 -0.147 -0.615* FVC -0.179 -0.078 -0.263 -0.177 -0.079 -0.133 -0.209 -0.038 -0.009 -0.111 -0.161 -0.407* DLCO 0.062 0.157 -0.365 -0.269 -0.154 0.020 0.041 -0.025 0.239 -0.227 -0.288 -0.224 RV -0.170 -0.095 -0.024 -0.112 0.048 0.035 -0.227 -0.025 -0.069 -0.138 0.009 0.009 TLC -0.149 0.155 -0.056 -0.020 -0.268 -0.270 -0.219 0.196 0.147 -0.038 -0.041 -0.113 RV/TLC 0.170 -0.092 0.187 -0.179 0.191 0.450* 0.118 -0.148 0.039 0.051 0.120 0.321 PEF 0.085 0.215 -0.153 -0.015 -0.235 -0.152 -0.044 0.060 0.028 -0.121 -0.140 -0.280 MEF75% 0.072 0.266 -0.055 0.084 -0.002 -0.155 -0.033 0.060 0.021 -0.133 0.013 -0.478* MEF50% 0.048 0.201 -0.067 -0.112 0.015 -0.243 -0.018 0.037 -0.004 -0.259 -0.043 -0.533* MEF25% -0.152 0.199 -0.214 0.024 -0.162 -0.180 -0.238 0.012 -0.176 -0.201 -0.174 -0.479* 注:* 为P<0.05。
下载: 导出CSV
表 5 C组各肺野SSD、LAV% 与肺功能指标的相关性分析
Table 5 Analysis of correlation between SSD and LAV% of the lung field and lung function indexes in group C
C组 右上 右中 右下 左上 左中 左下 SSD LAV% SSD LAV% SSD LAV% SSD LAV% SSD LAV% SSD LAV% FEV1 0.324 -0.453* 0.242 -0.435* -0.126 -0.555* 0.030 -0.575* 0.053 -0.554* 0.149 -0.519* FEV1% 0.302 -0.513* 0.209 -0.420* -0.007 -0.532* 0.076 -0.552* 0.068 -0.581* 0.205 -0.389* FVC -0.138 0.010 -0.181 -0.086 -0.284 -0.205 0.036 -0.137 -0.042 -0.156 -0.102 -0.291 DLCO 0.338 -0.282 0.511* -0.506* 0.420* -0.503* 0.395 -0.326 0.492* -0.523* 0.648* -0.410* RV -0.358 0.065 -0.315 0.221 0.260 0.347 -0.191 0.268 -0.199 0.490* -0.563* 0.325 TLC -0.033 -0.285 0.043 0.085 -0.362 -0.110 -0.248 -0.414* -0.136 -0.203 -0.136 -0.233 RV/TLC 0.150 0.042 0.048 0.130 -0.134 0.211 0.242 0.151 0.197 0.299 0.115 0.332 PEF 0.250 -0.535* 0.069 -0.324 -0.211 -0.469* -0.111 -0.575* -0.069 -0.476* 0.003 -0.530* MEF75% 0.161 -0.498* -0.036 -0.297 -0.266 -0.423* -0.199 -0.529* -0.178 -0.395 -0.053 -0.496* MEF50% 0.136 -0.376 -0.077 -0.229 -0.338 -0.329 -0.201 -0.367 -0.153 -0.286 -0.139 -0.431* MEF25% 0.040 -0.312 -0.031 -0.202 -0.377 -0.298 -0.221 -0.306 -0.114 -0.239 -0.141 -0.404* 注:* 为P<0.05。
下载: 导出CSV
-
[1] 韩欢, 徐绍德. 胸部多排螺旋CT扫描诊断职业性尘肺病的效果及准确率分析[J]. 影像研究与医学应用, 2021,5(8): 64−65. doi: 10.3969/j.issn.2096-3807.2021.08.030 HAN H, XU S D. Analysis of effect and accuracy of multi-slice spiral CT in the diagnosis of occupational pneumoconiosis[J]. Imaging Research and Medical Applications, 2021, 5(8): 64−65. (in Chinese). doi: 10.3969/j.issn.2096-3807.2021.08.030
[2] JONES C M, PASRICHA S S, HEINZE S B, et al. Silicosis in artificial stone workers: Spectrum of radiological high-resolution CT chest findings[J]. Journal Medical Imaging and Radiation Oncology, 2020, 64(2): 241−249. doi: 10.1111/1754-9485.13015
[3] PEREZ T, GARCIA G, ROCHE N, et al. Société de pneumologie de langue française. Recommandation pour la pratique clinique. Prise en charge de la BPCO. Mise à jour 2012. Exploration fonctionnelle respiratoire. Texte long [French Pulmonary Medicine Society. Guidelines for clinical practice. Management of COPD. Update 2012: Pulmonary function tests: Full length text][J]. Revue Des Maladies Respiratoires, 2014, 31(3): 263−294. doi: 10.1016/j.rmr.2013.11.007
[4] 刘阿茹, 魏华, 邓永红. HRCT肺气肿定量分析与COPD患者疾病相关性分析[J]. 中国CT和MRI杂志, 2021,19(8): 74−76. DOI: 10.3969/j.issn.1672-5131.2021.08.024. LIU A R, WEI H, DENG Y H. Analysis of correlation between quantitative analysisi of HRCT emphysema and COPD patients[J]. Chinese Journal of CT and MRI, 2021, 19(8): 74−76. DOI: 10.3969/j.issn.1672-5131.2021.08.024. (in Chinese).
[5] 卞明敏, 胡茂能. 职业性尘肺病肺部影像表现与肺功能改变关系的研究[J]. 职业卫生与应急救援, 2021,39(5): 519−523. DOI: 10.16369/j.oher.issn.1007-1326.2021.05.008. BIAN M M, HU M N. Study on the relationship pulmonary imaging manifestations and pulmonary function changes in occupational pnuemoconiosis[J]. Occupational Health and Emergency Rescue, 2021, 39(5): 519−523. DOI: 10.16369/j.oher.issn.1007-1326.2021.05.008. (in Chinese).
[6] ZAPOROZHAN J, LEY S, EBERHARDT R, et al. Paired inspiratory/expiratory volumetric thin-slice CT scan for emphysema analysis: Comparison of different quantitative evaluations and pulmonary function test[J]. Chest, 2005, 128(5): 3213−3220.
[7] 张雨洁, 俞同福. COPD患者肺气肿程度对气道径线与肺功能相关性的影响[J]. 实用放射学杂志, 2016,32(7): 1028−1032. DOI: 10.3969/j.issn.1002-1671.2016.07.009. ZHANG Y J, YU T F. Infiuence of the degree of emphysema on the correlation between airway line and lung function in COPD patients[J]. Journal of Applied Radiology, 2016, 32(7): 1028−1032. DOI: 10.3969/j.issn.1002-1671.2016.07.009. (in Chinese).
[8] VOGELMEIER C F, CRINER G J, MARTINEZ F J, et al. Global strategy for the diagnosis, management, and prevention of chronic obstructive lung disease 2017 report: GOLD executive summary[J]. American Journal of Respiratory and Critical Care Medicine, 2017, 49(6): 557−582.
[9] GBZ70-2015, 职业性尘肺病的诊断[S]. [10] 翟荣存, 李年春, 刘晓东, 等. 尘肺病小阴影密集度的CT分级方法及参考片探讨[J]. 中华劳动卫生职业病杂志, 2021,39(6): 453−457. DOI: 10.3760/cma.j.cn121094-20200917-00537. ZHAI R C, LI N C, LIU X D, et al. Discussion on CT grading method of small shadow density in pneumoconiosis and refernce film[J]. Chinese Journal of Labor Health and Occupational Diseases, 2021, 39(6): 453−457. DOI: 10.3760/cma.j.cn121094-20200917-00537. (in Chinese).
[11] MASHIMO S, CHUBACHI S, TSUTSUMI A, et al. Relationship between diminution of small pulmonary vessels and emphysema in chronic obstructive pulmonary disease[J]. Clinical Imaging, 2017, 46: 85−90. doi: 10.1016/j.clinimag.2017.07.008
[12] 余先超, 王朗, 温晓玲, 等. CT肺容积及肺密度与尘肺肺功能的相关性[J]. 中国医学影像学杂志, 2020,28(11): 846−848, 851. DOI: 10.3969/j.issn.1005-5185.2020.11.012. YU X C, WANG L, WEN X L, et al. Correlation of lung volume and lung density with pneumoconiosis[J]. Chinese Journal of Medical Imaging, 2020, 28(11): 846−848, 851. DOI: 10.3969/j.issn.1005-5185.2020.11.012. (in Chinese).
[13] 王雷, 沈聪, 邹常咏, 等. 基于CT定量评估肺气肿肺叶分布特点与肺功能的相关性[J]. 西安交通大学学报(医学版), 2018,39(6): 902−906. DOI: 10.7652/jdyxb201806026. WANG L, SHEN C, ZOU C Y, et al. Quantitative evealuation of the correlation between pulmonary lobe distribution characteristics and lung function in emphysema based on CT[J]. Journal of Xi'an Jiaotong University (Medical Edition), 2018, 39(6): 902−906. DOI: 10.7652/jdyxb201806026. (in Chinese).
[14] 兰长青, 王洁, 黄梅萍, 等. CT肺气肿指数及空间分布对慢性阻塞性肺疾病肺损伤的评估价值[J]. 中国临床医学影像杂志, 2021,32(5): 320−325. DOI: 10.12117/jccmi.2021.05.004. LAN C Q, WANG J, HUANG M P, et al. Evaluation of CT emphysema index and its spatial distribution in patients with chronic obstructive pulmonary disease[J]. Chinese Journal of Clinical Medical Imaging, 2021, 32(5): 320−325. DOI: 10.12117/jccmi.2021.05.004. (in Chinese).
[15] 王岩. 探析多层螺旋CT及后处理功能对早期尘肺诊断的应用价值[J]. 中国医疗器械信息, 2020,26(8): 151−152. DOI: 10.15971/j.cnki.cmdi.2020.08.076. WANG Y. Application of multislice spiral CT and post-processing in early diagnosis of pneumoconiosisi[J]. China Medical Device Information, 2020, 26(8): 151−152. DOI: 10.15971/j.cnki.cmdi.2020.08.076. (in Chinese).
[16] 胡必锋, 朱胜康, 翟荣存, 等. CT小阴影密集度判定方法及参考片在矽肺诊断中的应用[J]. 中华放射学杂志, 2021,55(11): 1172−1177. DOI: 10.3760/cma.j.cn112149-20210201-00085. HU B F, ZHU S K, ZHAI R C, et al. Determination of small shadow intensity in CT and application of reference film in diagnosis of silicosis[J]. Chinese Journal of Radiology, 2021, 55(11): 1172−1177. DOI: 10.3760/cma.j.cn112149-20210201-00085. (in Chinese).
[17] 夏养萱, 张健杰, 朱德香, 等. 尘肺病患者胸部螺旋CT影像与肺功能变化研究[J]. 职业卫生与应急救援, 2016,30(4): 267−269, 274. DOI: 10.16369/j.oher.issn.1007-1326.2016.04.001. XIA Y X, ZHANG J J, ZHU D X, et al. Study on spiral CT imaging of chest and pulmonary function in patients with pneumoconiosis[J]. Occupational Health and Emergency Rescue, 2016, 30(4): 267−269, 274. DOI: 10.16369/j.oher.issn.1007-1326.2016.04.001. (in Chinese).
[18] CHAMPLIN J, EDWARDS R, PIPAVATH S. Imaging of occupational lung disease[J]. Radiologic Clinics of North America, 2016, 54(6): 1077−1096. doi: 10.1016/j.rcl.2016.05.015
-
期刊类型引用(4)
1. 黄费湘. 多层螺旋CT多平面重建技术与数字化X线摄影对尘肺患者的诊断及其征象分析. 现代医用影像学. 2024(06): 1025-1027 .  百度学术
百度学术
2. 年洪慧. 青海省海西州尘肺病主要特征及其CT影像表现分析. 实用医学影像杂志. 2024(03): 175-178 . 百度学术
3. 周琅,袁梅,谢丽庄,韩磊,鲁珊珊. 尘肺病患者肺部CT特征与肺功能关联性研究进展. 职业卫生与应急救援. 2024(05): 676-679 . 百度学术
4. 黄宁,伍武,黄建桂. MSCT对粉尘作业引起的肺部弥漫性小结节的诊断及随访价值研究. 中国现代药物应用. 2023(24): 69-72 . 百度学术
其他类型引用(1)
计量
- 文章访问数: 315
- HTML全文浏览量: 114
- PDF下载量: 21
- 被引次数: 5


