
Enhanced CT Based Texture Analysis and Machine Learning for Differentiation between Adenolymphoma and Mixed Tumors of the Parotid Gland
-
摘要: 目的:探究基于增强CT纹理分析技术联合机器学习在腮腺腺淋巴瘤与混合瘤鉴别中的应用。方法:回顾性分析40例于本院手术并有完整病理资料的腮腺腺淋巴瘤与混合瘤患者,其中腺淋巴瘤组21例,混合瘤组19例。运用Mazda软件在增强CT静脉期图像上手动勾画病灶最大层面ROI区;应用Fisher系数、POE+ACC、MI及三者联合应用(FPM)的方法,筛选出最佳纹理参数,通过ROC曲线评估其诊断效能;最后采用RDA、PCA和LDA、NDA四种机器学习算法进行分类分析,并分析不同算法的诊断效能。结果:纹理特征参数中腺淋巴瘤组的WavEnHH_s-4、GrVariance、45dgr_Fraction低于混合瘤组,WavEnLL_s-4、GrSkewness高于混合瘤组,且均在组间有统计学意义。ROC曲线显示WavEnLL_s-4的敏感性与特异性较为平衡,AUC值、敏感性、特异性分别为0.797、84.2%、76.2%,具有良好诊断效能;RDA、PCA、LDA、NDA算法的误判率范围分别为30.0%~37.5%、30.0%~37.5%、7.5%~37.5%、5.0%~12.5%,其中误判率最低的是FPM联合NDA分类分析法,为5.0%;准确率、敏感性、特异性、阳性预测值、阴性预测值分别为95.0%、95.2%、94.7%、95.2%和94.7%,分类效能最佳。结论:增强CT纹理分析提取的最佳特征参数在腮腺腺淋巴瘤与混合瘤间具有显著差异,FPM联合NDA分类分析法误判率最低,有助于鉴别腮腺腺淋巴瘤与混合瘤。Abstract: Objective: To explore the application of enhanced computed tomography (CT)-based texture analysis combined with machine learning in the differential diagnosis of adenolymphomas and mixed tumors of the parotid gland. Methods: We retrospectively analyzed 21 and 19 cases of adenolymphomas and mixed tumors of the parotid gland, respectively. Regions of interest (ROI) were chosen on axial enhanced-CT images of the tumor’s maximum cross section using the Mazda software. The optimal texture parameters were selected using Fisher’s coefficient, probability of classification error and average correlation coefficients, mutual information, and a combination of the three. Receiver operating characteristic (ROC) curve analysis was performed to evaluate the diagnostic efficacy. Finally, the texture parameters were classified and analyzed using the following four machine-learning methods: raw data analysis, principal component analysis, linear discriminant analysis, and nonlinear discriminant analysis (NDA). The diagnostic efficiencies of these classification algorithms were analyzed. Results: WavEnHH_s-4, GrVariance, 45dgr_Fraction, WavEnLL_s-4, and GrSkewness were the statistically significant texture feature parameters for differentiating between parotid adenolymphomas and mixed tumors.. ROC curve analysis revealed that WavEnLL_s-4 had a balanced sensitivity and specificity, and the area under the curve, sensitivity, and specificity were 0.797, 84.2%, and 62.5%, respectively. The misclassification rate of NDA (5.0%–12.5%) was lower than that of the other algorithms. The NDA of FPM had the lowest misclassification rate (5.0%); its accuracy, sensitivity, specificity, positive predictive value, and negative predictive value were 95.0%, 95.2%, 94.7%, 95.2, and 94.7, respectively. Conclusion: The optimum enhanced CT-based texture features differed significantly between parotid adenolymphomas and mixed tumors. A combination of FPM and NDA had the lowest misclassification rate; it can contribute toward the identification of parotid adenolymphomas and mixed tumors.
-
Keywords:
- enhanced CT /
- machine learning /
- texture analysis /
- parotid tumor
-
腮腺肿瘤中约80% 为良性肿瘤,最常见的为腮腺混合瘤与腺淋巴瘤[1]。腮腺混合瘤虽然是良性肿瘤,但具有潜在恶性的生物学行为,术后局部复发及恶变风险均高于腺淋巴瘤[2]。因此术前精准诊断对临床手术方式与预后具有指导意义,腮腺混合瘤与腺淋巴瘤影像学表现具有一定交叉[3],常规影像学检查手段对两者之间鉴别困难。
CT纹理分析技术是一种能够进行定量分析的后处理技术,目前已广泛应用于良恶性鉴别、术前分期、疗效评价[4-5]等方面,已有研究应用CT平扫图像纹理分析用于腮腺肿瘤鉴别[6-7],但关于增强CT纹理分析对腮腺肿瘤的异质性研究较少。
本研究基于CT增强图像,探讨纹理分析技术联合机器学习算法鉴别腮腺混合瘤与腺淋巴瘤的可行性。
1. 材料与方法
1.1 临床资料
回顾性分析2016年1月至2021年12月于本院经手术病理确诊为腮腺腺淋巴瘤与混合瘤的患者40例。其中腮腺腺淋巴瘤21例,男性18例,女性3例,年龄40~77岁,平均年龄(62.24±11.17)岁,术前误诊混合瘤4例;腮腺混合瘤19例,男性6例,女性13例,年龄21~67岁,平均年龄(46.63±12.28)岁,术前误诊腺淋巴瘤1例。每个患者均有完整的病理资料,术前2周内均行增强CT检查。
排除标准:①CT检查前已治疗过或其他肿瘤病史;②存在明显伪影而影响观察。
1.2 扫描方法
采用Siemens或Philips多层螺旋CT对患者进行增强扫描,扫描范围从外耳孔至锁骨上平面。检查参数:球管电压120 kV,管电流200 mA,螺距1.0,层厚5 mm,重建矩阵512×512,重建层厚1 mm。
增强扫描按2.5 mL/s速率,静脉团注对比剂碘海醇1 mL/kg,动脉期于注射后25 s扫描,静脉期于注射后50 s扫描。
1.3 图像处理
1.3.1 图像导出及ROI选择
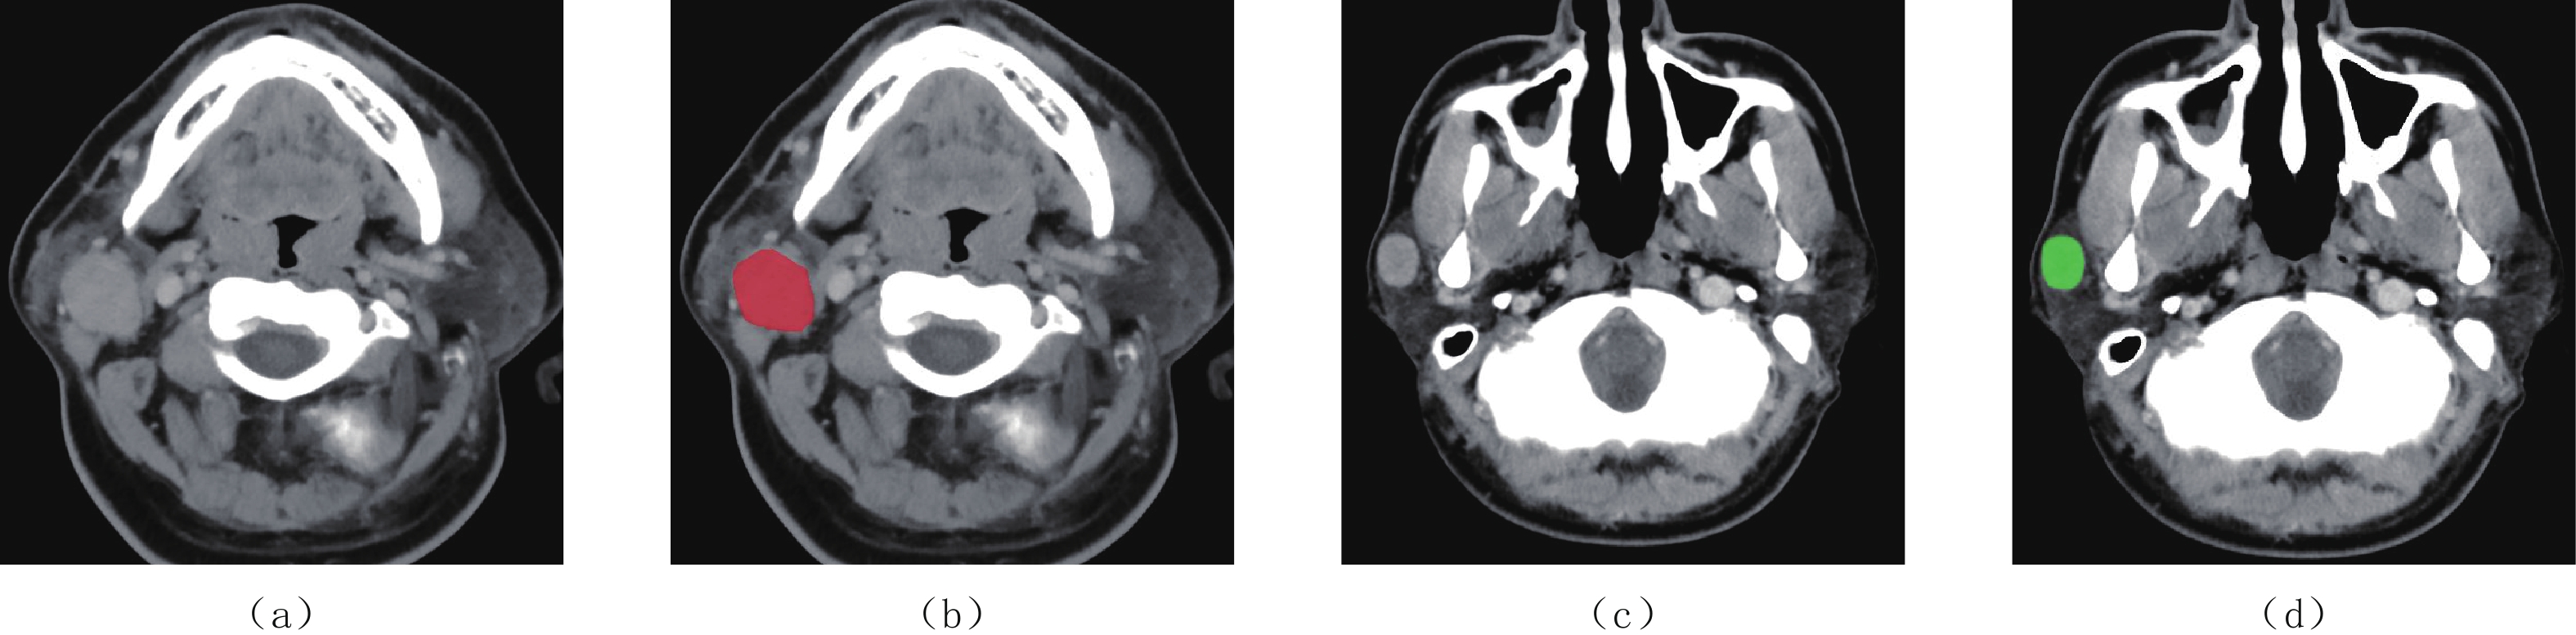
从PACS工作站中将患者病灶最大层面图像导出,导出图像保存为BPM格式,导出时确保所有图像窗宽窗位均为W250/L50。随后将图像导入Mazda软件,由两名高年资医师协商,沿病灶边缘1 mm左右勾画ROI(图1),尽量避开坏死、钙化及血管。
![]() 图 1 腮腺肿瘤CT静脉期图像以及ROIs(a)和(b)腺淋巴瘤,男,45岁;(c)和(d)多形性腺瘤,男,40岁。Figure 1. Enhanced CT images (with ROIs) of a parotid tumor
图 1 腮腺肿瘤CT静脉期图像以及ROIs(a)和(b)腺淋巴瘤,男,45岁;(c)和(d)多形性腺瘤,男,40岁。Figure 1. Enhanced CT images (with ROIs) of a parotid tumor1.3.2 纹理特征提取及筛选
运用Mazda软件自动获取6类纹理特征(包括直方图、灰度共生矩阵、游程矩阵、绝对梯度、自回归模型及小波转换),共312项纹理特征。采用Fisher系数、POE+ACC、MI 4种降维筛选方式以及3种降维方式的联合运用(FPM)。
1.3.3 纹理特征分类分析
运用Mazda软件的B11模块,对获得的纹理特征进行分类分析。该软件主要包括原始数据分析(RDA)、主要成分分析(PCA)、线性判别分析(LDA)和非线性判别分析(NDA)4种机器学习算法。计算不同降维方式联合不同机器学习算法的误判率、准确率、敏感性、特异性、阳性预测值、阴性预测值。
1.4 统计学处理
采用SPSS 22.0统计分析软件进行分析,计量资料的表示方式为均数±标准差,即(
$\bar x \pm s $ ),对本次研究的4种纹理特征筛选方法中出现3次以上的特征参数进行统计分析。符合正态分布的采用独立样本的t检验,不符合正态分布的运用Wilcoxon秩和检验,以P<0.05认为差异具有统计学意义。建立ROC曲线,并计算其AUC值,获得研究所需的诊断阈值,并计算敏感性和特异性,比较其诊断效能。
2. 结果
2.1 腮腺腺淋巴瘤与混合瘤的纹理参数比较
运用Fisher、POE+ACC、MI以及FPM分别提取的最有代表性的纹理特征参数各10、10、10、30项,其中出现3次以上的参数共5项(表1)。其中WavEnHH_s-4、WavEnLL_s-4为小波转换参数;GrVariance、GrSkewness为绝对梯度参数,45dgr_Fraction为游程矩阵参数。
表 1 腮腺腺淋巴瘤与混合瘤间最佳纹理特征参数比较Table 1. Comparison of the optimal texture feature parameters between parotid adenolymphomas and mixed tumors参数 组别 统计检验 腺淋巴瘤组 混合瘤组 t/Z P WavEnHH_s-4 4.162±1.908 7.493±3.157 -4.084 <0.01 WavEnLL_s-4 21044.469±3887.164 16649.289±4309.226 3.392 0.002 GrVariance 0.185±0.046 0.236±0.033 -4.055 <0.01 GrSkewness 1.996±0.516 1.475±0.295 -3.291 0.001 45 dgr_Fraction 0.328±0.080 0.422±0.074 -3.854 <0.01 腮腺腺淋巴瘤组的WavEnHH_s-4、GrVariance、45 dgr_Fraction低于混合瘤组,WavEnLL_s-4、GrSkewness高于混合瘤组,且均在组间有统计学意义。
2.2 腮腺腺淋巴瘤与混合瘤纹理参数的ROC曲线分析
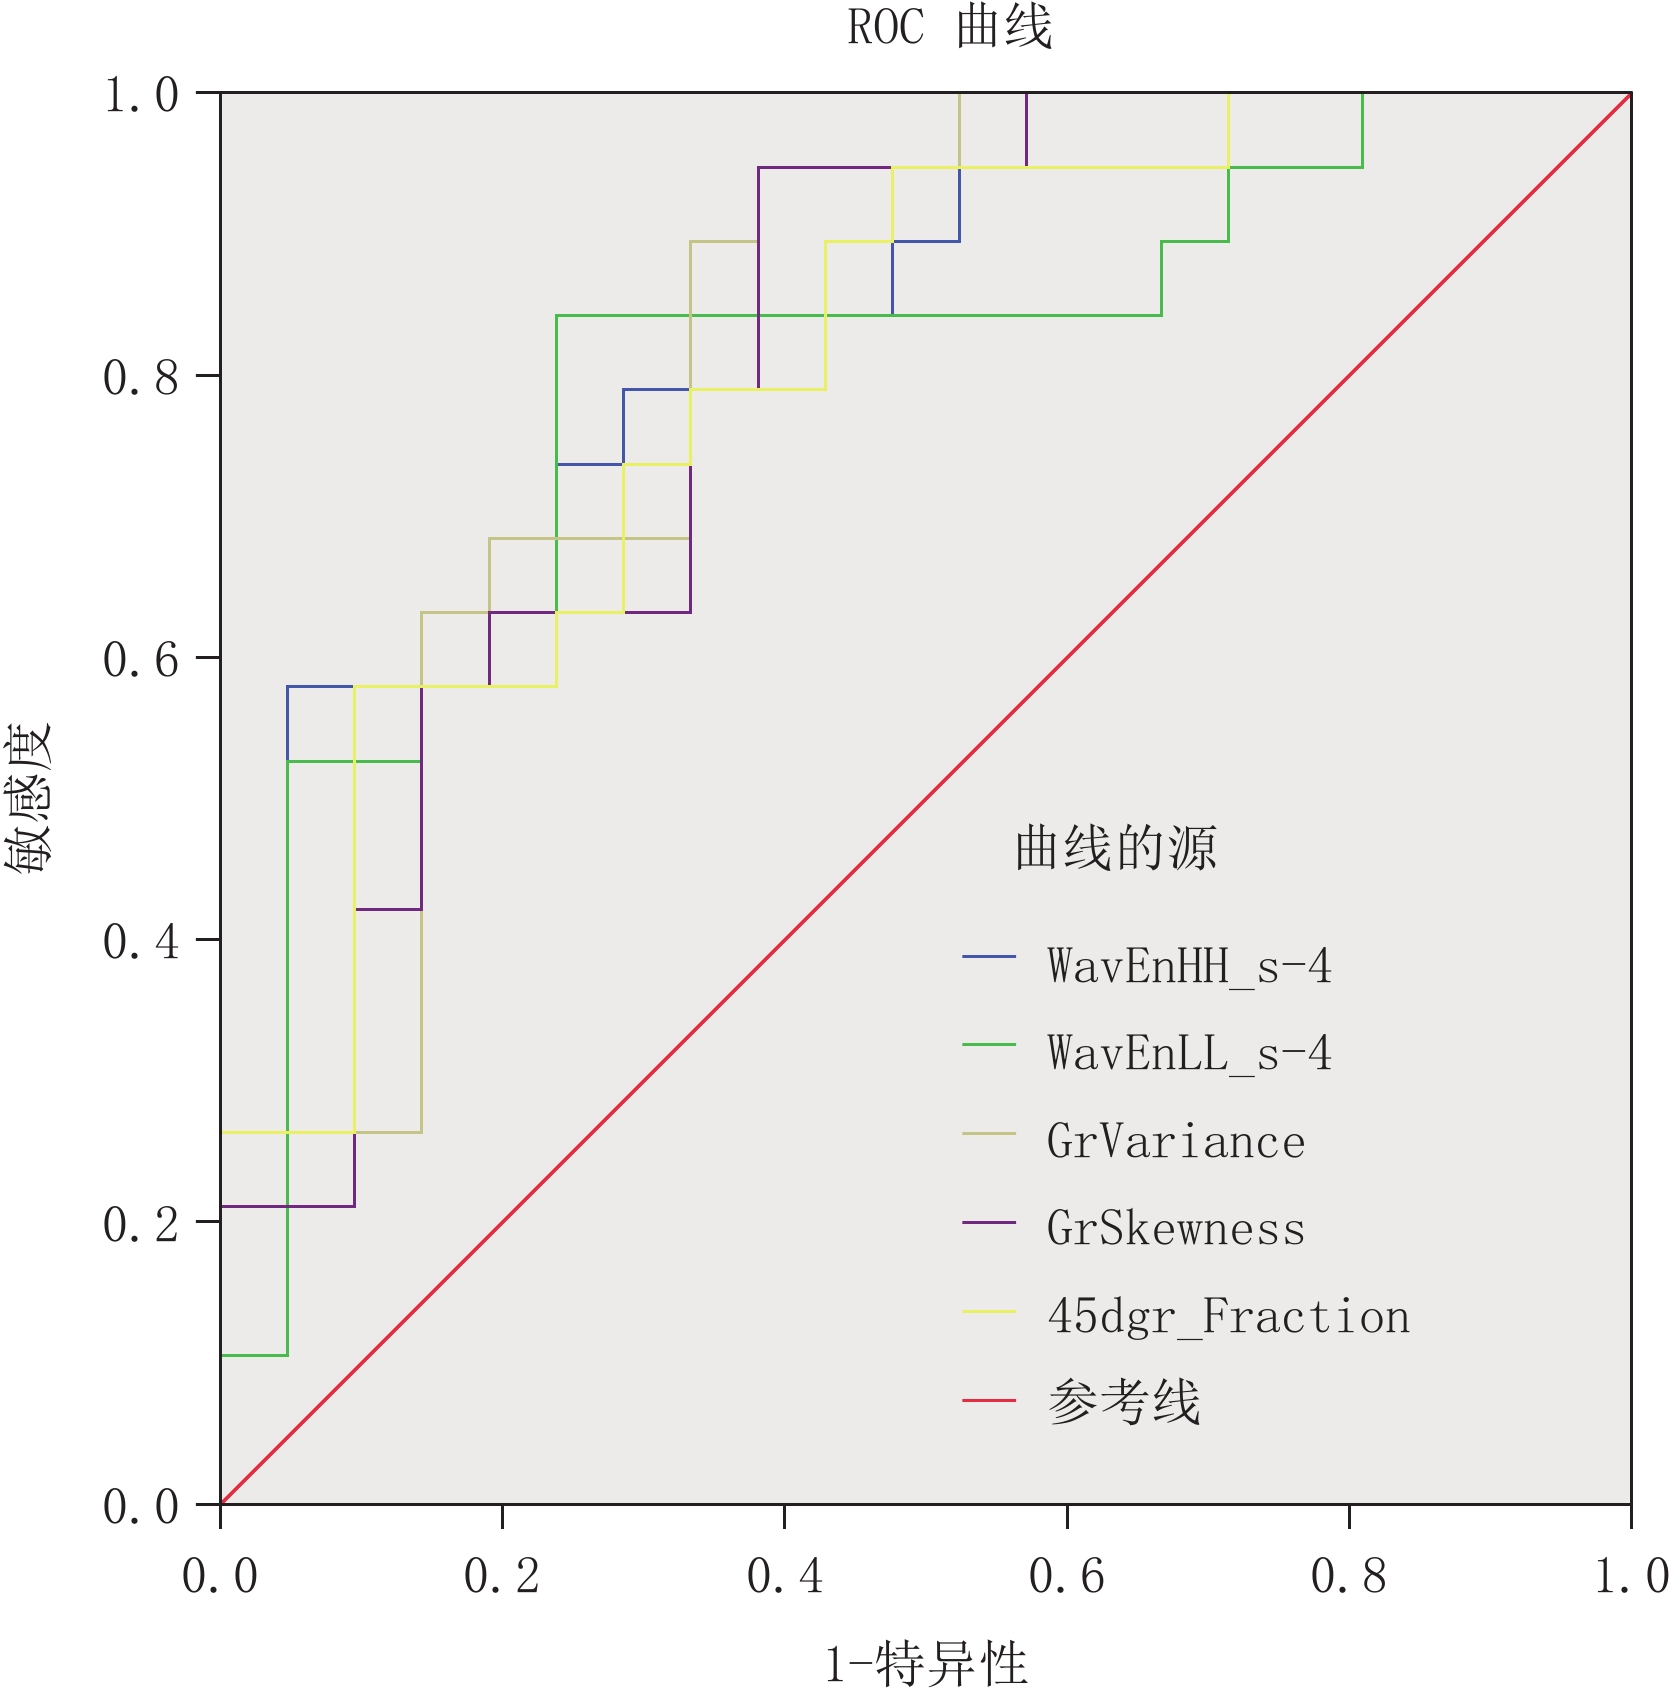
本研究针对具有统计学意义的纹理参数建立ROC曲线,并对其诊断效能进行分析,结果见表2及图2。鉴别腮腺腺淋巴瘤与混合瘤AUC最高的是WavEnHH_s-4,为0.827,其相应的敏感性、特异性分别为84.2%、66.7%;鉴别腮腺腺淋巴瘤与混合瘤敏感性最高的是GrSkewness,其AUC值、敏感性、特异性分别为0.805、94.7%、61.9%,特异性较低;鉴别腮腺腺淋巴瘤与混合瘤特异性最高的是WavEnLL_s-4,其AUC值、敏感性、特异性分别为0.797、84.2%、76.2%,敏感性与特异性较为平衡,具有良好诊断效能。
表 2 腮腺腺淋巴瘤与混合瘤间最佳纹理特征参数的诊断效能Table 2. Diagnostic performance of the optimal texture feature parameters for parotid adenolymphomas and mixed tumors参数 AUC 阈值 敏感性/% 特异性/% P WavEnHH_s-4 0.827 4.979 84.2 66.7 <0.01 WavEnLL_s-4 0.797 19227.148 84.2 76.2 0.001 GrVariance 0.815 0.200 89.5 66.7 0.001 GrSkewness 0.805 1.819 94.7 61.9 0.001 45 dgr_Fraction 0.802 0.384 73.7 71.4 0.001 ![]() 图 2 腮腺腺淋巴瘤与混合瘤组间WavEnHH_s-4、WavEnLL_s-4、GrVariance、GrSkewness、45 dgr_Fraction的ROC曲线Figure 2. ROC curves for WavEnHH_s-4, WavEnLL_s-4, GrVariance, GrSkewness, 45 dgr_Fraction for differentiating between adenolymphomas and mixed tumors of the parotid gland
图 2 腮腺腺淋巴瘤与混合瘤组间WavEnHH_s-4、WavEnLL_s-4、GrVariance、GrSkewness、45 dgr_Fraction的ROC曲线Figure 2. ROC curves for WavEnHH_s-4, WavEnLL_s-4, GrVariance, GrSkewness, 45 dgr_Fraction for differentiating between adenolymphomas and mixed tumors of the parotid gland2.3 腮腺腺淋巴瘤与混合瘤纹理特征的分类分析
运用B11模块中4种机器学习方法对不同纹理筛选方式进行分类分析。RDA、PCA、LDA、NDA算法的误判率范围分别为30.0%~37.5%、30.0%~37.5%、7.5%~37.5%、5.0%~12.5%,其中误判率最低的是FPM联合NDA算法,为5.0%,低于本研究放射科术前诊断误诊率12.5%(5/40);其准确率、敏感性、特异性、阳性预测值、阴性预测值分别为95.0%、95.2%、94.7%、95.2%、94.7%,结果见表3及表4。
表 3 腮腺腺淋巴瘤与混合瘤间不同机器学习算法的误判率Table 3. False-positive rates of different machine-learning algorithms for parotid adenolymphomas and mixed tumors组别 RDA/% PCA/% LDA/% NDA/% Fisher 37.5(15/40) 37.5(15/40) 10.0(4/40) 7.5(3/40) POE+ACC 35.0(14/40) 30.0(12/40) 22.5(9/40) 10.0(4/40) MI 30.0(12/40) 30.0(12/40) 37.5(15/40) 12.5(5/40) FPM 35.0(14/40) 32.5(13/40) 7.5(3/40) 5.0(2/40) 表 4 腮腺腺淋巴瘤与混合瘤间不同机器学习算法的效能比较Table 4. Comparison of the performance of different machine-learning algorithms for parotid adenolymphomas and mixed tumors分类算法 准确率/% 敏感性/% 特异性/% 阳性预测值 阴性预测值 Fisher/RDA 62.5 61.9 63.2 65.0 60.0 Fisher/PCA 62.5 61.9 63.2 65.0 60.0 Fisher/LDA 90.0 95.2 84.2 87.0 94.1 Fisher/NDA 92.5 90.5 94.7 95.0 90.0 POE+ACC/RDA 65.0 76.2 52.6 64.0 66.7 POE+ACC/PCA 70.0 76.2 63.2 69.6 70.6 POE+ACC/LDA 77.5 76.2 78.9 80.0 75.0 POE+ACC/NDA 90.0 85.7 94.7 94.7 85.7 MI/RDA 70.0 76.2 63.2 69.6 70.6 MI/PCA 70.0 76.2 63.2 69.6 70.6 MI/LDA 62.5 66.7 57.9 63.6 61.1 MI/NDA 87.5 81.0 94.7 94.4 81.8 FPM/RDA 65.0 66.7 63.2 66.7 63.2 FPM/PCA 67.5 71.4 63.2 68.2 66.7 FPM/LDA 92.5 95.2 89.5 90.9 94.4 FPM/NDA 95.0 95.2 94.7 95.2 94.7 3. 讨论
腮腺腺淋巴瘤与混合瘤为腮腺最常见的良性肿瘤,两者在CT平扫上均表现为颌面部包块,形态规则,边界清晰。增强扫描时,腮腺混合瘤多呈轻度延迟强化;腺淋巴瘤多呈快进快出方式强化,但也有部分影像表现有交叉[8],且影像诊断主观性强,诊断经验和诊断标准不一。
CT纹理分析技术是对医学图像像素分布特征进行数学统计的图像后处理技术,能够定量评估肿瘤的异质性[9]。刘文华等[6]通过CT平扫纹理分析技术发现,纹理参数偏度、峰度在鉴别腮腺混合瘤与腺淋巴瘤中具有统计学意义;任思桐等[7]研究发现基于CT平扫图像的纹理特征中位数、均值、体素值和、标准差、偏度可以鉴别腮腺混合瘤和恶性肿瘤。两者均以CT平扫图像为研究对象,且选取的是低阶纹理参数,而增强图像能够通过强化方式的不同反应病灶内组织差异,更好地体现纹理参数的差异性。本文基于增强CT图像选取高阶纹理参数联合机器学习的方式,探讨鉴别腮腺腺淋巴瘤与混合瘤的可行性。
本研究通过4种降维方式筛选出最佳纹理特征5个,腮腺腺淋巴瘤组的WavEnHH_s-4、GrVariance、45 dgr_Fraction低于混合瘤组,WavEnLL_s-4、GrSkewness高于混合瘤组,且均在组间有统计学意义。45 dgr_Fraction即45°方向游程图像分数,属于游程矩阵参数,反应的是该矩阵的像素在一定方向上出现的频率。
任继亮等[10]研究发现基于游程矩阵纹理参数能够用于鉴别眼眶淋巴瘤与炎性假瘤,不同病理类型的肿瘤游程矩阵参数也有差异。GrVariance即绝对梯度方差、GrSkewness即绝对梯度偏度,属于绝对梯度参数,反应病灶内部像素分布的复杂程度[11]。WavEnHH_s-4即高高频小波转换系数、WavEnLL即低低频小波转换系数[12],反应的是区域内像素在高高频、低低频率能量的空间分布情况。绝对梯度参数与小波转换系数属于高阶纹理参数,徐圆等[13]发现小波转换系数在不同分化程度肾透明细胞癌中具有统计学差异,低频量越丰富图像纹理越模糊,与本研究结果相符。
本研究中腮腺腺淋巴瘤由上皮样和淋巴样组织构成,内富含粘液成分,且易囊变并有胆固醇结晶,混合瘤由上皮细胞、变异肌上皮细胞、黏液样或软骨样组织构成[14];增强后腺淋巴瘤强化更显著,更易囊变,内部密度分布不均,导致图像纹理粗糙模糊;两者组织学上的不同反映为纹理参数的差异性。
机器学习算法中,从降维方式来看FPM算法的误诊例总数最少,而MI误诊例总数最多。从机器学习算法来看,NDA算法的误诊例总数最少,而RDA误诊例总数最多。且FPM联合NDA分类分析法误诊率最低(5.0),低于本研究放射科术前诊断误诊率(12.5),能够帮助放射科诊断医师提高诊断准确率。
余先超等[15]基于CT平扫图像机器学习算法对腮腺腺淋巴瘤与混合瘤的鉴别中,MI/NDA算法具有最高的特异度,MI/RDA、MR/PCA灵敏度最高,但该研究缺少了纹理特征参数最多的FPM降维方式。FPM降维方式选择的参数为3种降维方式的联合应用,包含的纹理参数最多、最优,能够充分的反应腮腺肿瘤的纹理信息,这与既往研究相符。尹进学等[16]的研究结果显示,基于常规T2 WI图像纹理特征,NDA分类联合FPM纹理降维方法对预测早期宫颈鳞癌盆腔淋巴结转移的误判率最低;徐圆等[17]的研究结果表明,基于常规胸部增强CT图像纹理特征,NDA纹理特征分类方法对预测肺腺癌淋巴结转移的正确率最高,明显优于RDA、PCA和LDA,具有较好的诊断效能。由此可见,FPM联合NDA算法可以用于鉴别腮腺腺淋巴瘤与混合瘤。
本研究还存在的局限性:①本研究为回顾性分析,样本量偏小,病例可能存在选择偏倚;②本研究仅对腮腺肿瘤的最大层面进行分析,没有勾画三维ROI区,会缺乏一些纹理信息;③纹理参数的提取缺乏操作规范,提高研究的可重复性。下一步本研究将加大样本量、多中心的影像组学研究验证。
综上所述,增强CT纹理分析提取的最佳特征参数在腮腺腺淋巴瘤与混合瘤间具有显著差异,其中WavEnLL_s-4的敏感性与特异性较为平衡,具有良好的诊断效能,且FPM联合NDA算法误判率最低,有助于鉴别腮腺腺淋巴瘤与混合瘤,能够帮助放射科诊断医师提高诊断准确率。
-
![]()
图 1 腮腺肿瘤CT静脉期图像以及ROIs
(a)和(b)腺淋巴瘤,男,45岁;(c)和(d)多形性腺瘤,男,40岁。
Figure 1. Enhanced CT images (with ROIs) of a parotid tumor
![]()
图 2 腮腺腺淋巴瘤与混合瘤组间WavEnHH_s-4、WavEnLL_s-4、GrVariance、GrSkewness、45 dgr_Fraction的ROC曲线
Figure 2. ROC curves for WavEnHH_s-4, WavEnLL_s-4, GrVariance, GrSkewness, 45 dgr_Fraction for differentiating between adenolymphomas and mixed tumors of the parotid gland
表 1 腮腺腺淋巴瘤与混合瘤间最佳纹理特征参数比较
Table 1 Comparison of the optimal texture feature parameters between parotid adenolymphomas and mixed tumors
参数 组别 统计检验 腺淋巴瘤组 混合瘤组 t/Z P WavEnHH_s-4 4.162±1.908 7.493±3.157 -4.084 <0.01 WavEnLL_s-4 21044.469±3887.164 16649.289±4309.226 3.392 0.002 GrVariance 0.185±0.046 0.236±0.033 -4.055 <0.01 GrSkewness 1.996±0.516 1.475±0.295 -3.291 0.001 45 dgr_Fraction 0.328±0.080 0.422±0.074 -3.854 <0.01  下载: 导出CSV
表 2 腮腺腺淋巴瘤与混合瘤间最佳纹理特征参数的诊断效能
Table 2 Diagnostic performance of the optimal texture feature parameters for parotid adenolymphomas and mixed tumors
参数 AUC 阈值 敏感性/% 特异性/% P WavEnHH_s-4 0.827 4.979 84.2 66.7 <0.01 WavEnLL_s-4 0.797 19227.148 84.2 76.2 0.001 GrVariance 0.815 0.200 89.5 66.7 0.001 GrSkewness 0.805 1.819 94.7 61.9 0.001 45 dgr_Fraction 0.802 0.384 73.7 71.4 0.001
下载: 导出CSV
表 3 腮腺腺淋巴瘤与混合瘤间不同机器学习算法的误判率
Table 3 False-positive rates of different machine-learning algorithms for parotid adenolymphomas and mixed tumors
组别 RDA/% PCA/% LDA/% NDA/% Fisher 37.5(15/40) 37.5(15/40) 10.0(4/40) 7.5(3/40) POE+ACC 35.0(14/40) 30.0(12/40) 22.5(9/40) 10.0(4/40) MI 30.0(12/40) 30.0(12/40) 37.5(15/40) 12.5(5/40) FPM 35.0(14/40) 32.5(13/40) 7.5(3/40) 5.0(2/40)
下载: 导出CSV
表 4 腮腺腺淋巴瘤与混合瘤间不同机器学习算法的效能比较
Table 4 Comparison of the performance of different machine-learning algorithms for parotid adenolymphomas and mixed tumors
分类算法 准确率/% 敏感性/% 特异性/% 阳性预测值 阴性预测值 Fisher/RDA 62.5 61.9 63.2 65.0 60.0 Fisher/PCA 62.5 61.9 63.2 65.0 60.0 Fisher/LDA 90.0 95.2 84.2 87.0 94.1 Fisher/NDA 92.5 90.5 94.7 95.0 90.0 POE+ACC/RDA 65.0 76.2 52.6 64.0 66.7 POE+ACC/PCA 70.0 76.2 63.2 69.6 70.6 POE+ACC/LDA 77.5 76.2 78.9 80.0 75.0 POE+ACC/NDA 90.0 85.7 94.7 94.7 85.7 MI/RDA 70.0 76.2 63.2 69.6 70.6 MI/PCA 70.0 76.2 63.2 69.6 70.6 MI/LDA 62.5 66.7 57.9 63.6 61.1 MI/NDA 87.5 81.0 94.7 94.4 81.8 FPM/RDA 65.0 66.7 63.2 66.7 63.2 FPM/PCA 67.5 71.4 63.2 68.2 66.7 FPM/LDA 92.5 95.2 89.5 90.9 94.4 FPM/NDA 95.0 95.2 94.7 95.2 94.7
下载: 导出CSV
-
[1] YAMAMOTO T, KIMURA H, HAYASHI K, et al. Pseudo-continuous arterial spin labeling MR images in Warthin tumors and pleomorphic adenomas of the parotid gland: Qualitative and quantitative analyses and their correlation with histopathologic and DWI and dynamic contrast enhanced MRI findings[J]. Neuroradiology, 2018, 60(8): 803−812. doi: 10.1007/s00234-018-2046-9
[2] ZHENG C Y, CAO R, GAO M H, et al. Comparison of surgical techniques for benign parotid tumours: A multicentre retrospective study[J]. International Journal of Oral & Maxillofacial Surgery, 2018, 48(2): 187−192.
[3] 胡涛, 刘琼, 邹玉坚, 等. 扩散峰度成像及动态增强MRI鉴别腮腺多形性腺瘤与Warthin瘤[J]. 放射学实践, 2021,36(9): 1089−1094. HU T, LIU Q, ZOU Y J, et al. Application value of DKI and DEC-MRI in the differential diagnosis of parotid pleomorphic adenoma and Warthin tumor[J]. Journal of Radiology Practice, 2021, 36(9): 1089−1094. (in Chinese).
[4] PARK H J, LEE S M, SONG J W, et al. Texture-based automated quantitative assessment of regional patterns on initial CT in patients with idiopathic pulmonary fibrosis: Relationship to decline in forced vital capacity[J]. American Journal of Roentgenology, 2016, 207(5): 976−983. doi: 10.2214/AJR.16.16054
[5] AHN S J, KIM J H, PARK S J, et al. Prediction of the therapeutic response after FOLFOX and FOLFIRI treatment for patients with liver metastasis from colorectal cancer using computerized CT texture analysis[J]. European Journal of Radiology, 2016, 85: 1867−1874. doi: 10.1016/j.ejrad.2016.08.014
[6] 刘文华, 张衡, 李敏, 等. CT图像纹理分析鉴别诊断腮腺混合瘤与腺淋巴瘤[J]. 临床放射学杂志, 2019,38(12): 2271−2274. LIU W H, ZHANG H, LI M, et al. CT texture analysis in the differential diagnosis of mixed tumor of parotid gland and adenolymphoma[J]. Journal of Clinical Radiology, 2019, 38(12): 2271−2274. (in Chinese).
[7] 任思桐, 李小虎, 刘斌, 等. CT平扫图像纹理分析鉴别腮腺多形性腺瘤与恶性肿瘤的初步研究[J]. CT理论与应用研究, 2019,28(6): 685−691. DOI: 10.15953/j.1004-4140.2019.28.06.06. REN S T, LI X H, LIU B, et al. Preliminary study on differentiating pleomorphic adenoma and malignant tumors of the parotid gland by texture analysis of non-enhanced CT images[J]. CT Theory and Applications, 2019, 28(6): 685−691. DOI: 10.15953/j.1004-4140.2019.28.06.06. (in Chinese).
[8] 茂盛, 王嗣伟, 晋丹丹, 等. 腮腺多形性腺瘤与腺淋巴瘤的CT影像特征及对比分析[J]. 实用放射学杂志, 2019,33(1): 28−46. MAO S, WANG S W, JIN D D, et al. CT imaging characteristics and comparative analysis of parotid pleomorphic adeonoma and adenolymphoma[J]. Journal of Practical Radiology, 2019, 33(1): 28−46. (in Chinese).
[9] 茅枭骁, 征锦. CT纹理分析技术在甲状腺结节影像研究中的应用进展[J]. 医疗卫生装备, 2020,41(12): 97−100. MAO X X, ZHENG J. Research progress of CT texture analysis for imaging studies of thyroid nodules[J]. Medical and Health Equipment, 2020, 41(12): 97−100. (in Chinese).
[10] 任继亮, 吴颖为, 陶晓峰, 等. 常规MRI纹理分析鉴别诊断眼眶淋巴瘤与炎性假瘤[J]. 中国医学影像技术, 2017,33: 980−984. REN J L, WU Y W, TAO X F, et al. MRI texture analysis in differential diagnosis of orbital lymphoma and inflammatory pseudotumor[J]. Chinese Journal of Medical Imaging Technology, 2017, 33: 980−984. (in Chinese).
[11] DODGSON T, MEDICINES M D, SCHEDAR N, et al. Can quantitative CT texture analysis be used to differentiate fat-poor renal policewoman from renal cell carcinoma on enhancement CT images[J]. Radiology, 2015, 276(3): 787−796. doi: 10.1148/radiol.2015142215
[12] SUDARSHAN V K, MOOKIAH M R, ACHARYA U R, et al. Application of wavelet techniques for cancer diagnosis using ultrasound images: A review[J]. Computers in Biology & Medicine, 2016, 69: 97−111.
[13] 徐圆, 段钰, 吴晶涛, 等. 基于CT增强扫描的纹理分析技术鉴别肾脏透明细胞癌恶性程度的可行性研究[J]. 临床放射学杂志, 2019,38: 1693−1697. XU Y, DUAN Y, WU J T, et al. Preoperative assessment of pathological grade of clear cell renal cell carcinoma by texture analysis based on CT enhanced images[J]. Journal of Clinical Radiology, 2019, 38: 1693−1697. (in Chinese).
[14] 周明, 钱斌, 翟晓东. 腮腺腺淋巴瘤与多形性腺瘤的双期增强CT表现与鉴别[J]. 临床放射学杂志, 2012,31: 1243−1246. ZHOU M, QIAN B, ZHAI X D. CT differential diagnosis between parotid gland lymphoma and pleomorphic adenoma[J]. Journal of Clinical Radiology, 2012, 31: 1243−1246. (in Chinese).
[15] 余先超, 孙宇凤, 李鹏, 等. 影像组学在腮腺多形性腺瘤与腺淋巴瘤鉴别诊断中的应用[J]. 现代肿瘤医学, 2021,29(5): 837−840. doi: 10.3969/j.issn.1672-4992.2021.05.025 YU X C, SUN Y F, LI P, et al. Application of radiomics in the differential diagnosis of parotid pleomorphic adenoma and adenolymphoma of the parotid gland[J]. Modern Oncology, 2021, 29(5): 837−840. (in Chinese). doi: 10.3969/j.issn.1672-4992.2021.05.025
[16] 尹进学, 汤日杰, 钟熹, 等. 常规T2WI纹理分析预测早期宫颈鳞癌盆腔淋巴结转移的价值[J]. 临床放射学杂志, 2020,39: 358−362. YIN J X, TANG R J, ZHONG X, et al. Value of conventional T2-weighted images texture analysis in predicting pelvic lymph node metastasis in early-stage cervical cancer[J]. Journal of Clinical Radiology, 2020, 39: 358−362. (in Chinese).
[17] 徐圆, 段钰, 曹正业, 等. CT纹理组学联合机器学习预测肺腺癌淋巴结转移[J]. 临床放射学杂志, 2020,39: 691−695. XU Y, DUAN Y, CAO Z Y, et al. Value of texture analysis combined with machine learning based on enhanced CT of lung adenocarcinoma in prediction of lymph node metastasis[J]. Journal of Clinical Radiology, 2020, 39: 691−695. (in Chinese).
-
期刊类型引用(3)
1. 郭虎. 多层螺旋CT在腮腺肿瘤性质鉴别诊断中的应用价值分析. 临床研究. 2025(03): 28-32 .  百度学术
百度学术
2. 施久刚,茅枭骁,唐银,马树声,张磊,卢亮. 基于CT平扫纹理分析预测腮腺多形性腺瘤包膜浸润的初步研究. 影像研究与医学应用. 2024(03): 67-69 . 百度学术
3. 孟宪鑫,王栋,庞华军,徐瑞辰. CT纹理分析对腮腺肿瘤良恶性的鉴别价值. 影像研究与医学应用. 2024(15): 68-70 . 百度学术
其他类型引用(1)

计量
- 文章访问数: 261
- HTML全文浏览量: 163
- PDF下载量: 28
- 被引次数: 4


