
The Lithospheric Structure of the Middle Solonker−Xar Moron Suture by Surface-wave Tomography
-
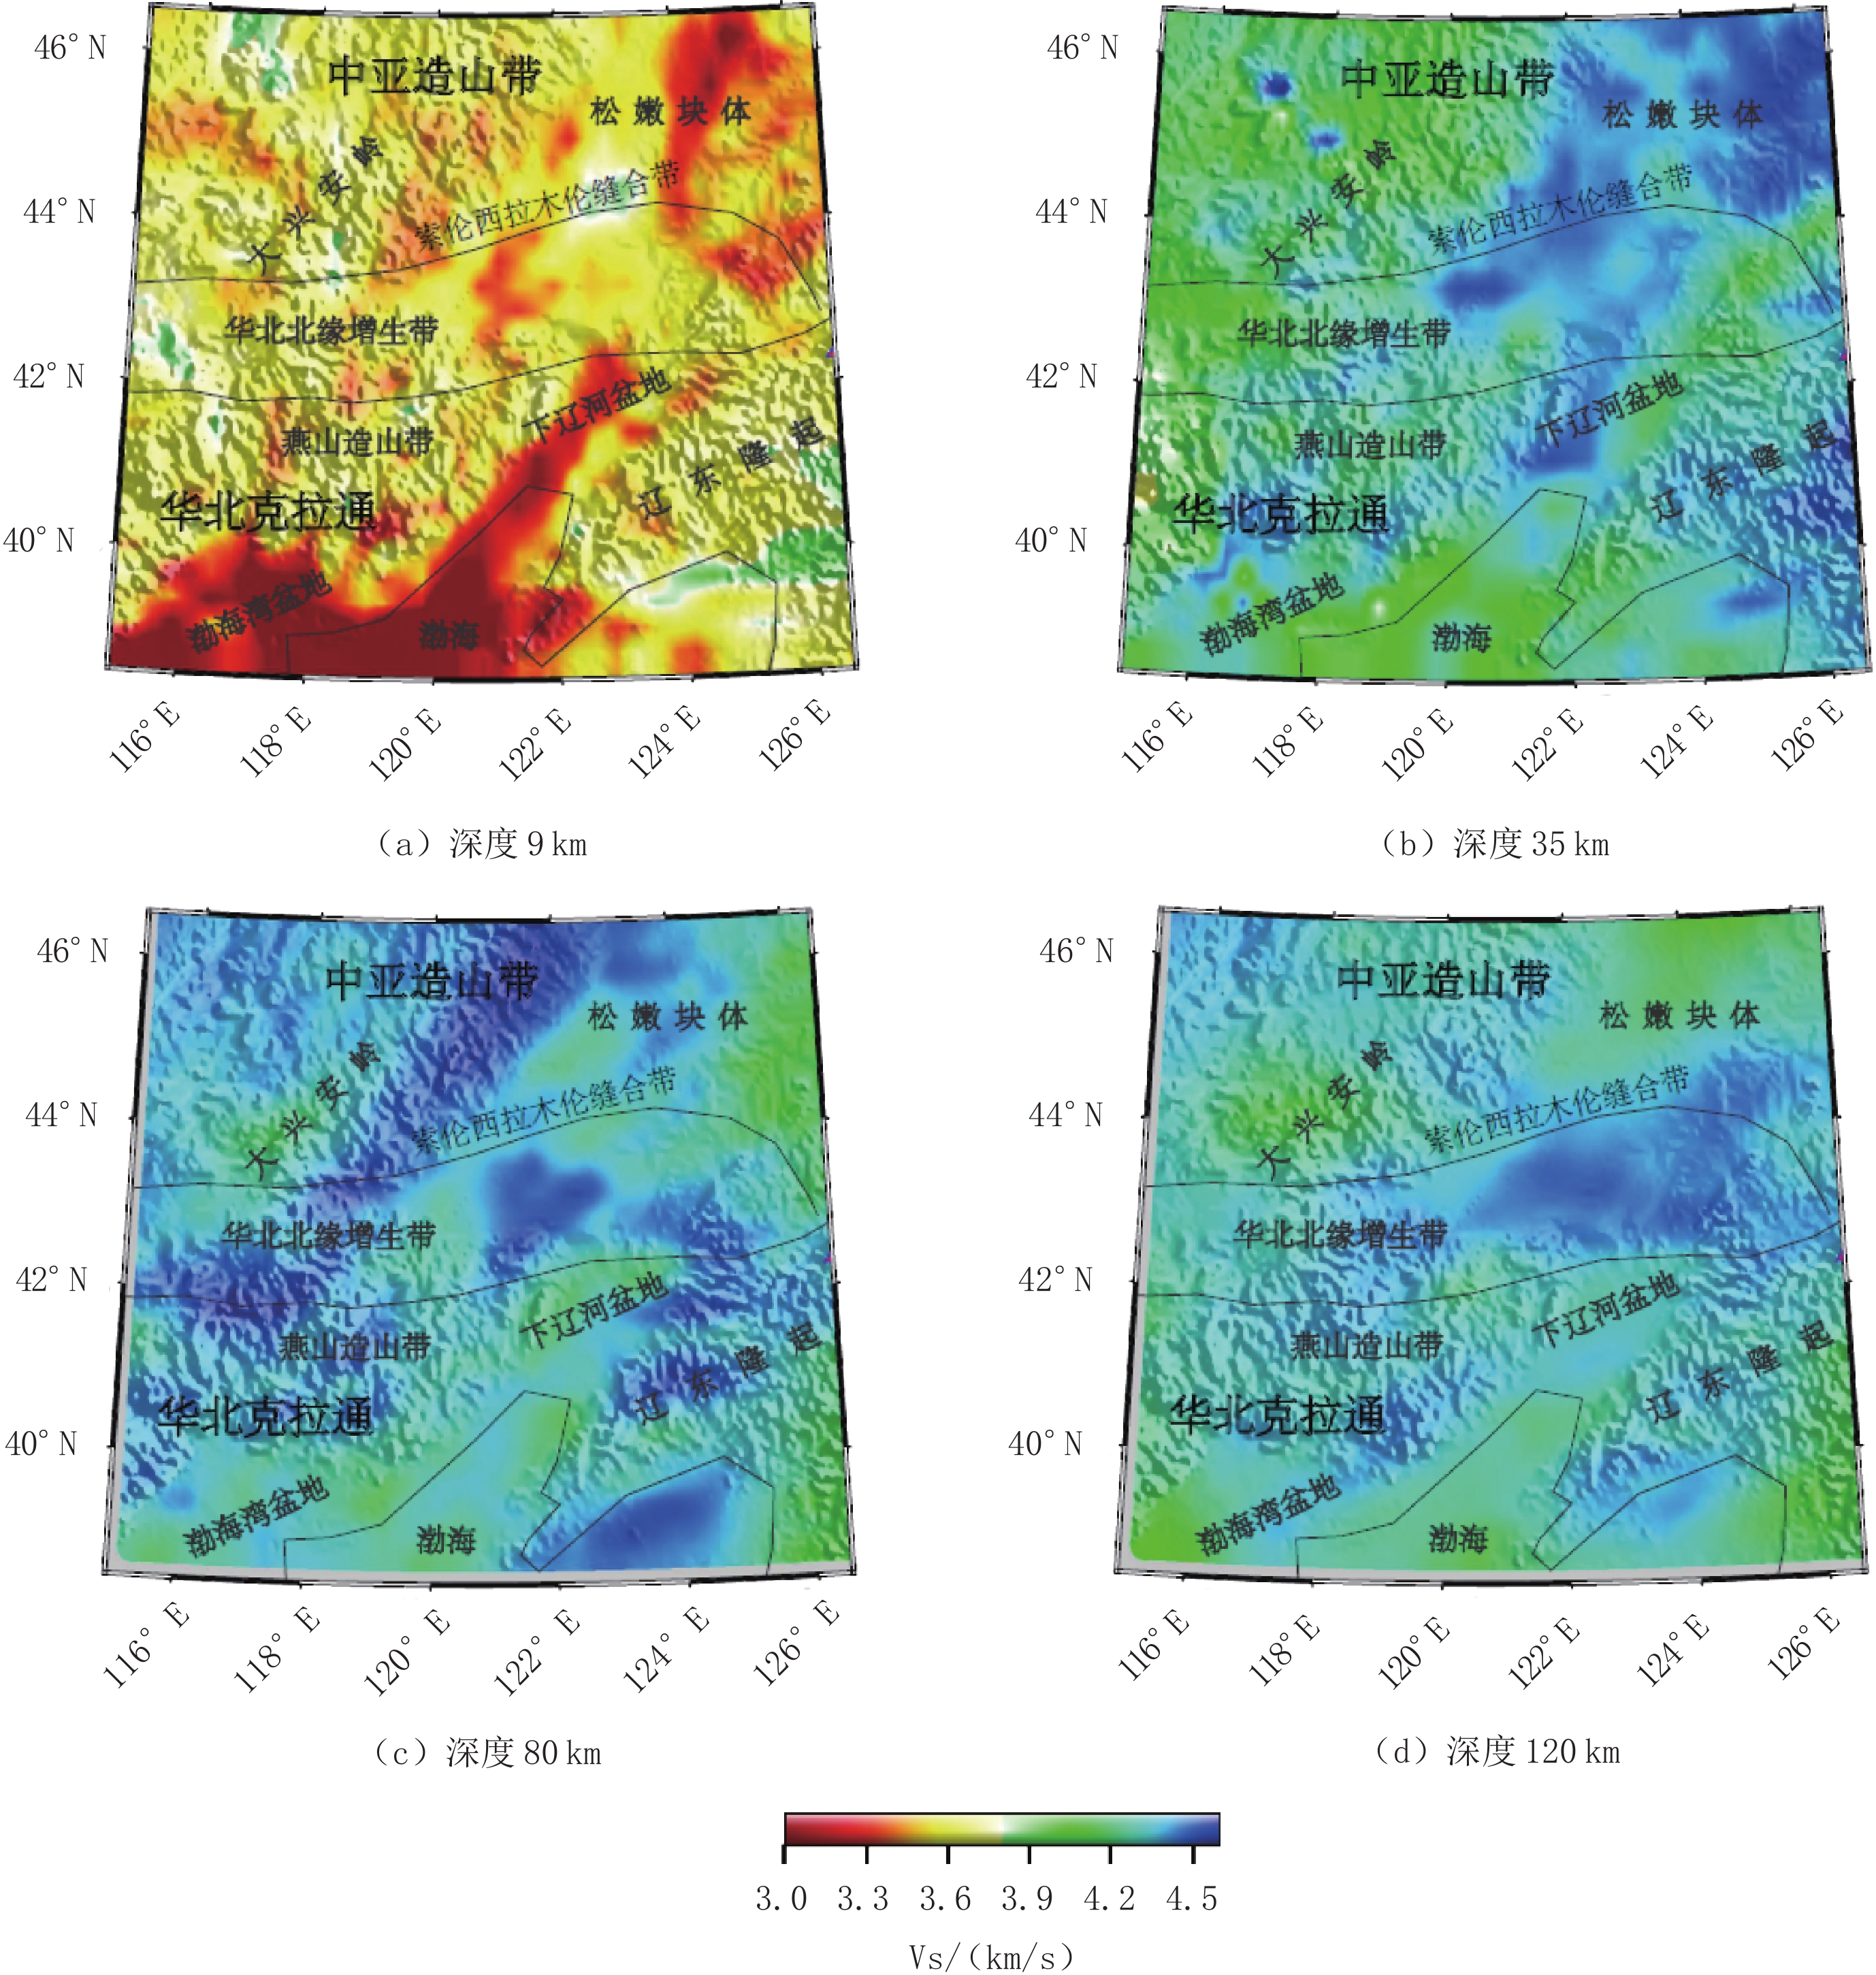
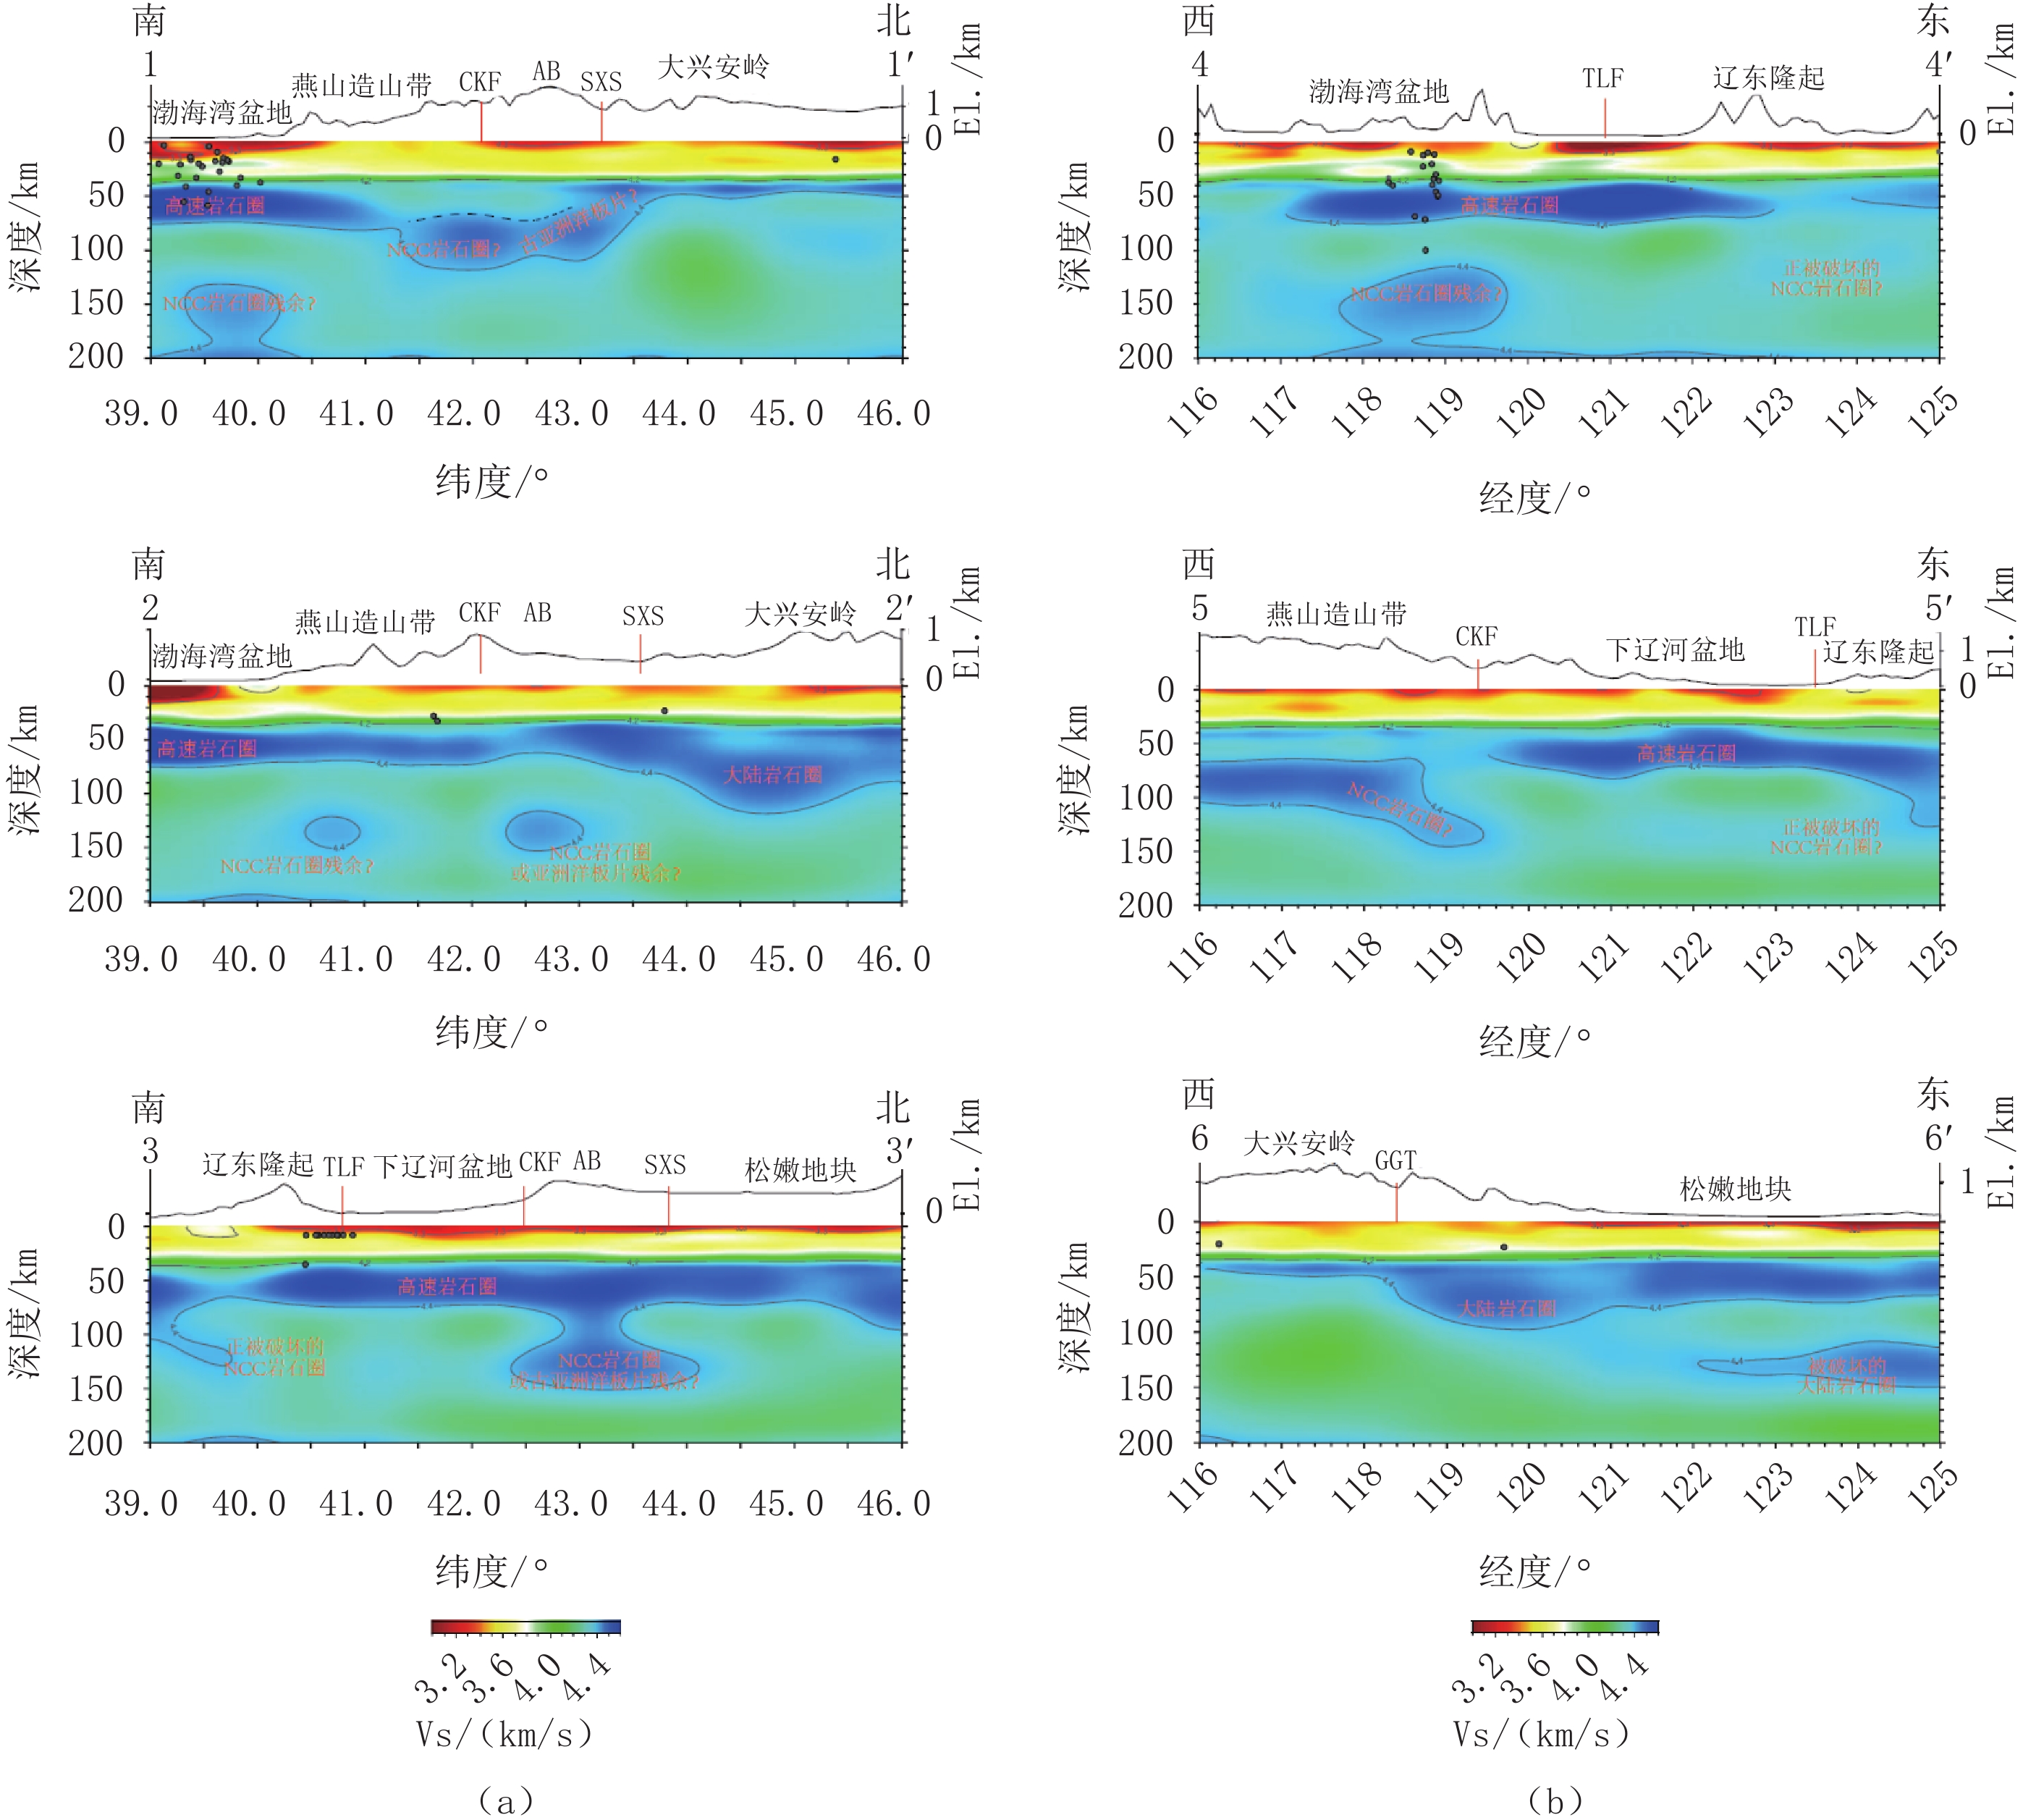
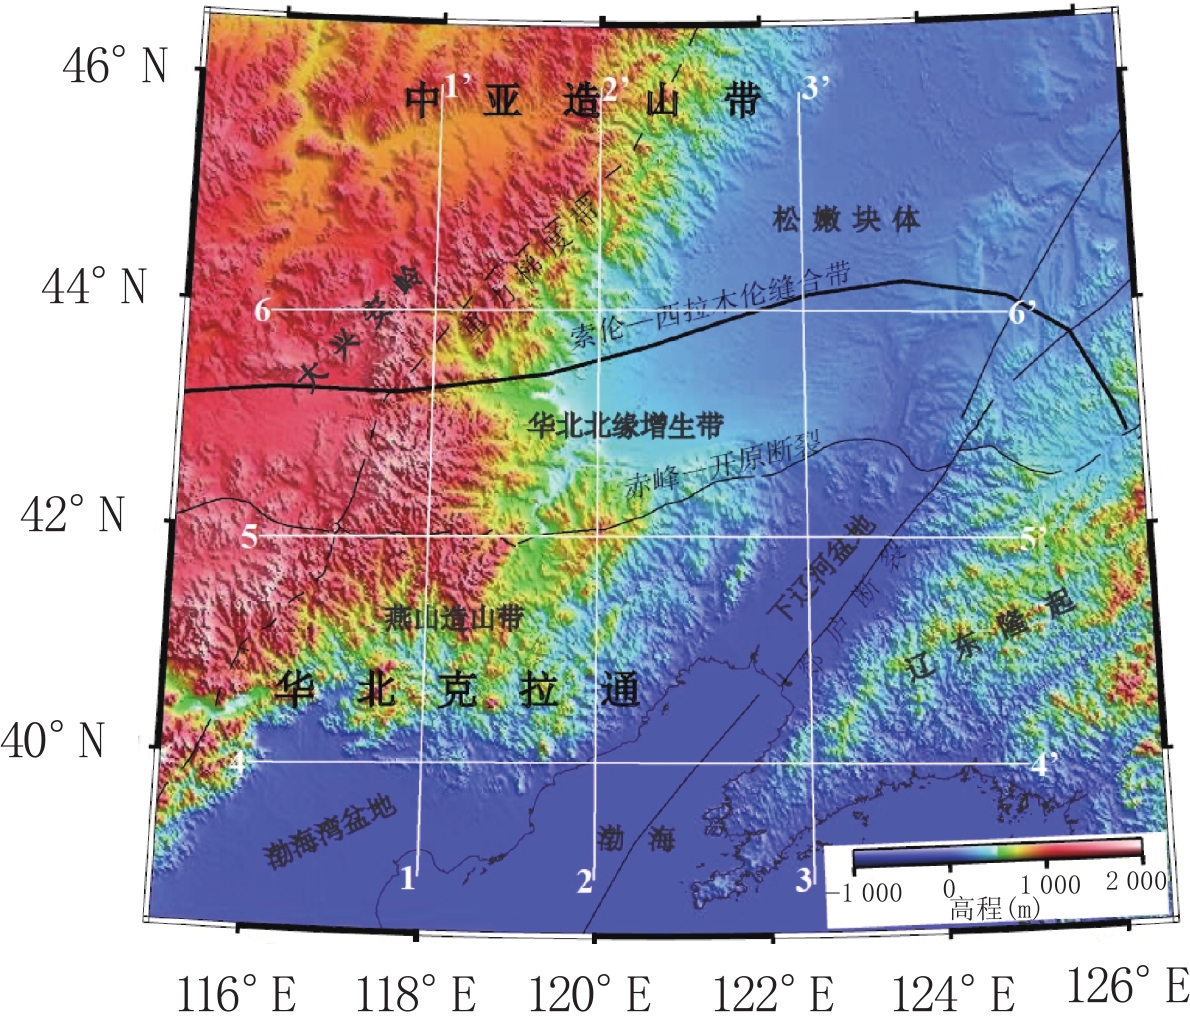
摘要: 索伦-西拉木伦缝合带中段及周边区域先后经历了古生代古亚洲洋闭合、中生代蒙古鄂霍茨克洋闭合和中新生代太平洋俯冲等构造复合叠加,导致该区深部构造异常复杂。本研究从该区近年来累积的宽频地震探测资料的地震面波和环境噪音互相关格林函数中提取瑞雷波群速度频散,并据此反演区域尺度的三维横波速度。结果发现:区域地壳厚度横向变化不大,松辽盆地和下辽河盆地地壳比大兴安岭薄,地壳厚度与地形吻合表明这些地区基本达到重力均衡状态;而辽东隆起和渤海湾盆地地壳厚度与地形高度呈反相关,表明这些地区可能仍处于构造改造过程中。在80 km深度之下,波速分布则呈现与索伦-西拉木伦缝合带走向近似平行的东西向展布。以索伦-西拉木伦缝合带为界,南北两侧横波速分布复杂程度明显不同且南侧的东西两部分复杂程度也不同。这些结果表明区域受太平洋俯冲体系冲破坏程度存在明显差异,同时索伦-西拉木伦缝合带以南可能仍有古亚洲洋板片残留。
-
关键词:
- 面波层析成像 /
- 三维横波速度 /
- 索伦-西拉木伦缝合带 /
- 华北克拉通 /
- 中亚造山带东段
Abstract: The middle section of the Solonker-Xar Moron suture and its surrounding areas have successively been affected by the closure of the Paleo-Asian Ocean during the Paleozoic, the closure of the Mongolian-Okhotsk Ocean during the Mesozoic, and the subduction of the Pacific Ocean plate since the Meso-Cenozoic, resulting in very complex, deep structures in this area. We conducted a regional-scale three-dimensional S-wave velocity tomographic study of the area. To do this, we used surface waves from earthquake data and ambient noise data recorded in recent years. The lithospheric tomographic model shows that the regional crustal thickness does not vary considerably, but the crust in the Songliao and the Lower Liaohe basins is thinner than that in the Daxing'an Mountains. The fact that the crustal thickness remains consistent with changes in topography indicates that these areas have reached gravitational equilibrium. However, the crustal thickness of the Liaodong uplift and the Bohai Bay Basin is inversely related with topography, indicating that these areas may still be in a tectonically active state. At depths greater than 80 km, the S-wave velocities spread in an east-west direction approximately parallel to the Solonker-Xar Moron suture. The complexity of the upper-mantle velocity distribution to the north of the Solonker-Xar Moron suture differs significantly from that to its south. Furthermore, south of the Solonker-Xar Moron suture, the complexity of the velocity distribution in the east differs considerably from that in the west. This implies that the destruction resulting from the Pacific Ocean subduction system varies significantly within the study region, and remnants of the paleo-Asian ocean slab may still exist in the south. -
窗技术的合理应用在CT诊断中非常重要,特别在胸部CT。由于肺内大部分病变,如肿块、炎症、间质病变等病变及周围结构的复杂性,对临床放射医师来说,除了常规选择肺窗、纵隔窗,应用更多的窗口设置能更好的观察、诊断病变。
人工智能当前在胸部CT的应用越来越多,包括图像分割、病变检测、病变分类等领域[1],如肺结节的检测、良性和恶性肺结节的分类、肺癌分期等。卷积神经网络(convolutional neural networks,CNN)是深度学习的一种代表性算法,它能很好的提取和组合空间特征以形成高级特征[2-5]。
目前文献中报道的人工智能对CT数据的处理一般是运用CT机扫描时的原始数据或选择其中一种窗宽窗位(常为肺窗),较少考虑到窗口设置对人工智能结果的影响。因此本研究与中国科学院计算技术研究所合作,选择了3种不同的3D CNN的算法:ResNet、ResNext以及DenseNet,并在每1种3D CNN算法中应用不同的CT窗口设置,探讨CT窗技术对3D CNN分类肺部病变结果的影响。
1. 资料与方法
1.1 一般资料
回顾性分析2013年3月至2018年3月在首都医科大学附属北京友谊医院诊断为周围型肺癌的172例患者及诊断为局灶性肺炎的185例的患者胸部CT薄层影像,分为两组:周围型肺癌组和局灶性肺炎组。其中周围型肺癌组(94名男性和78名女性,年龄范围为32~82岁;平均年龄为63岁)均经手术后病理证实(病理类型包括腺癌、鳞状细胞癌和小细胞癌);局灶性肺炎组(85名男性和100名女性,年龄范围为8~96岁;平均年龄为44岁)均经抗炎治疗后复查实变病变吸收。
所有患者选择胸部CT平扫图像(非增强检查),CT扫描参数:CT扫描仪为GE Discovery CT 750 HD,扫描仪参数为120 kVp,5 mm准直采集,螺距为0.984~1,重建厚度为1.25 mm,或飞利浦iCT,扫描仪参数为120 kVp,5 mm准直采集,螺距为0.915,重建厚度为1.25 mm。每幅图像的像素分辨率为512×512。
5种窗口设置(窗宽,窗位):肺窗(1500,-600);纵隔窗(350,40);自定义窗口1(SW1)(1000,40);自定义窗口2(SW2)(1000,-100);全窗(4096,1024)。自定义窗口1(SW1)是选择和纵隔窗相同的窗位,然后扩大窗宽为1000;自定义窗口2(SW2)是选择和SWI相同的窗宽1000,窗位定为 -100;全窗是将CT扫描及DICOM图像存储的原始数据CT值范围为-1024~3071 HU换算成的窗宽窗位(4096,1024)。5种窗口设置下的病变显示见图1。
![]() 图 1 不同窗口设置时对病灶的显示不同:(a)~(e)左肺上叶周围型肺癌(腺癌);(f)~(j)右肺下叶局灶性肺炎(a)和(f)肺窗;(b)和(g)纵隔窗;(c)和(h)SW1;(d)和(i)SW2;(e)和(j)全窗Figure 1. Different display of lesions in different windows: (a)~(e) is the same patient, diagnosed as peripheral lung cancer in the upper lobe of the left lung (pathological examination shows adenocarcinoma); (f)~(j) is the same patient, diagnosed as focal pneumonia in the lower lobe of the right lung
图 1 不同窗口设置时对病灶的显示不同:(a)~(e)左肺上叶周围型肺癌(腺癌);(f)~(j)右肺下叶局灶性肺炎(a)和(f)肺窗;(b)和(g)纵隔窗;(c)和(h)SW1;(d)和(i)SW2;(e)和(j)全窗Figure 1. Different display of lesions in different windows: (a)~(e) is the same patient, diagnosed as peripheral lung cancer in the upper lobe of the left lung (pathological examination shows adenocarcinoma); (f)~(j) is the same patient, diagnosed as focal pneumonia in the lower lobe of the right lung1.2 3D CNN的设置
本研究与中国科学院计算技术研究所合作,对图像进行预处理,并选择3种不同的3D CNN的算法:ResNet、ResNext以及DenseNet。
本研究的图像预处理是在三维图像空间中进行,步骤包括:①高斯去噪,应用sigma为0.5的高斯滤波器,将图像的背景噪声去除;②肺分割,使用基于阈值的方法进行粗略肺分割;③对齐及缩放,根据肺实质区域的分割结果得到肺实质区域的边界框,将输入大小统一设置为(96,64,96)。
ResNet网络的超参数:使用Adam优化器,初始学习率为0.0001,β1=0.9,β2=0.999,权值衰减为0.001。所有实验都经过200个epochs的训练。计算机配备Intel Core i7-8700 CPU和NVIDIA GTX1080 ti GPU,深度学习平台为PyTorch。网络构建:主干使用18层的3D ResNet网络(图2),最后,利用一个全局池化层和一个具有两个输出的全连接层,将病例分为两类:周围型肺癌与局灶性肺炎。为了避免训练数据的过度拟合,在最后一个全连接层之前使用一个比率为0.5的dropout层[6]。
![]() 图 2 3D ResNet网络构建主干使用18层的3D ResNet网络,在每个卷积块中,有1个卷积层(其参数在图中列出)、1个批标准化(Batch Normalization)层和1个ReLu激活层,图中的第1个参数“3×3×3”表示3D内核大小,第3个参数“64、128、256、512”表示通道数,最后1个参数“/2”表示步长为2的池层。Figure 2. 3D ResNet network design
图 2 3D ResNet网络构建主干使用18层的3D ResNet网络,在每个卷积块中,有1个卷积层(其参数在图中列出)、1个批标准化(Batch Normalization)层和1个ReLu激活层,图中的第1个参数“3×3×3”表示3D内核大小,第3个参数“64、128、256、512”表示通道数,最后1个参数“/2”表示步长为2的池层。Figure 2. 3D ResNet network designResNext网络及DenseNet分别为50层的主干及121层的主干,并保持其他训练参数与ResNet的参数相同。
ResNext对于ResNet中的每一个模块(Block)进行多次重复之后再对结果求和,该构建块的不同重复单元具有相同的网络拓扑结构以减轻网络结构设计负担。与ResNet相比,它增加了重复次数这一新维度,即基数(Cardinality),作为深度和宽度维度之外的重要因素[7](图3)。
![]()
相比ResNet,DenseNet引入密集连接机制。每个层都会将前面所有层作为其输入。图4表示DenseNet的密集连接机制。网络的每一层都会与前面所有层在通道维度连接在一起,并作为下一层的输入[8]。
1.3 统计分析
使用IBM SPSS 19进行数据分析,进行5倍交叉验证,计算分类准确率,绘制受试者工作特征曲线(receiver operating characteristic curve,ROC),统计曲线下面积(area under curve,AUC)。使用medcalc 19.1版本Delong测试进行ROC曲线的两两对比,统计Z值及P值,并以P<0.05为差异具有统计学意义。
2. 结果
本研究将整个数据集随机分成5个部分,进行5倍交叉验证,结果表明3种神经网络之间的分类诊断效能没有太大差异,总体来说ResNext的性能稍差,DenseNet的性能稍好。在窗口设置方面,ResNet的平均分类准确率最低为纵隔窗;平均分类准确率最高为全窗。ResNext的平均分类准确率最低为纵隔窗;平均分类准确率最高为全窗。DenseNet的平均分类准确率最低为纵隔窗;平均分类准确率最高为自定义窗口2(表1~表3)ROC曲线图见图5~图7。
表 1 ResNet 5个窗口设置的5倍交叉验证的分类准确率(%)及AUC结果Table 1. Classification accuracy (%) and AUC results of 5-fold cross validation of 5 window settings in ResNet窗口 (WW,WL) Fold 1 Fold 2 Fold 3 Fold 4 Fold 5 平均分类准确率/% AUC 肺窗 (1500,−600) 87.50 88.73 91.55 91.55 93.06 90.478 0.929 纵隔窗 (350,40) 80.56 87.32 90.14 85.92 84.72 85.732 0.871 SW1 (1000,40) 86.11 92.96 88.73 91.55 90.28 89.926 0.918 SW2 (1000,−100) 87.50 92.96 90.14 91.55 90.28 90.486 0.923 Full (4096,1024) 87.50 90.14 90.14 94.37 95.83 91.596 0.946 表 2 ResNext 5个窗口设置的5倍交叉验证的分类准确率(%)及AUC结果Table 2. Classification accuracy (%) and AUC results of 5-fold cross validation of 5 window settings in ResNext窗口 (WW,WL) Fold 1 Fold 2 Fold 3 Fold 4 Fold 5 平均分类准确率/% AUC 肺窗 (1500,−600) 84.72 80.14 87.32 88.73 87.50 85.682 0.896 纵隔窗 (350,40) 77.78 83.10 81.69 84.51 80.56 81.528 0.814 SW1 (1000,40) 86.11 85.92 88.73 85.92 84.72 86.280 0.881 SW2 (1000,−100) 84.72 88.73 83.10 85.92 87.50 85.994 0.878 Full (4096,1024) 83.33 91.55 85.92 87.32 84.72 86.568 0.882 表 3 DenseNet 5个窗口设置的5倍交叉验证的分类准确率(%)及AUC结果Table 3. Classification accuracy (%) and AUC results of 5-fold cross validation of 5 window settings in DenseNet窗口 (WW,WL) Fold 1 Fold 2 Fold 3 Fold 4 Fold 5 平均分类准确率/% AUC 肺窗 (1500,−600) 87.50 91.55 92.96 94.37 93.06 91.888 0.944 纵隔窗 (350,40) 88.89 87.32 91.55 84.51 87.50 87.954 0.906 SW1 (1000,40) 94.44 94.37 90.14 90.14 93.06 92.430 0.932 SW2 (1000,−100) 93.06 95.77 91.55 91.55 94.44 93.274 0.951 Full (4096,1024) 91.67 92.96 90.14 94.37 94.44 92.716 0.941 将ResNet网络的5种窗口下的ROC曲线进行了两两对比,结果如下:肺窗与纵隔窗AUC的值比较有统计意义(Z=3.099,P=0.002);肺窗与SW1之间(Z=0.800,P=0.424)、肺窗与SW2之间(Z=0.478,P=0.633)、肺窗与全窗之间(Z=1.811,P=0.072)的AUC值比较均无统计学意义。纵隔窗与SW1(Z=2.884,P=0.004)、纵隔窗与SW2(Z=2.869,P=0.004)、纵隔窗与全窗(Z=4.115,P=0.000)之间的AUC值比较均有统计学意义。SW1与SW2之间无统计学意义(Z=0.376,P=0.707)。SW1与全窗之间有统计学意义(Z=2.043,P=0.041),SW2与全窗之间无统计学意义(Z=1.705,P=0.088)。
将ResNext网络的5种窗口下的ROC曲线进行了两两对比,结果如下:肺窗与纵隔窗AUC的值比较有统计意义(Z=4.161,P=0.000);肺窗与SW1之间(Z=0.918,P=0.358)、肺窗与SW2之间(Z=1.210,P=0.226)、肺窗与全窗之间(Z=1.079,P=0.2806)的AUC值比较均无统计学意义。纵隔窗与SW1(Z=3.652,P=0.000)、纵隔窗与SW2(Z=3.265,P=0.000)、纵隔窗与全窗(Z=3.336,P=0.001)之间的AUC值比较均有统计学意义。SW1与SW2之间无统计学意义(Z=0.177,P=0.860)。SW1与全窗之间有统计学意义(Z=0.0338,P=0.969,SW2与全窗之间无统计学意义(Z=0.210,P=0.834)。
将DensNet网络的5种窗口下的ROC曲线进行了两两对比,结果如下:肺窗与纵隔窗AUC的值比较有统计意义(Z=2.332,P=0.020);肺窗与SW1之间(Z=0.962,P=0.336)、肺窗与SW2之间(Z=0.659,P=0.510)、肺窗与全窗之间(Z=294,P=0.769)的AUC值比较均无统计学意义。纵隔窗与SW1(Z=2.193,P=>0.028)、纵隔窗与SW2(Z=2.854,P=0.004)之间的AUC值比较均有统计学意义。纵隔窗与全窗(Z=1.951,P=0.051)的AUC值比较无统计学意义。SW1与SW2之间无统计学意义(Z=1.583,P=0.116)。SW1与全窗之间有统计学意义(Z=0.617,P=0.537),SW2与全窗之间无统计学意义(Z=0.866,P=0.389)。
3. 讨论
本研究应用了3种不同的3D CNN的算法及5种CT窗口设置,初步探讨CT窗技术对人工智能分类肺部病变结果的影响。
由于人体不同组织间CT值有差异,而人眼仅能识别16灰阶,因此合理应用窗技术在CT检查中非常重要。特别在胸部CT,既要观察低密度的含气肺组织(CT值约 -700至 -1000 HU),又要观察中等密度的软组织(CT值约30~80 HU),以及高密度的骨组织(CT值约150~1000 HU以上)。在临床胸部影像读片过程中,至少要采用肺窗、纵隔窗来分别观察肺野和纵隔。其中肺窗能清楚显示病变边缘及周围肺组织,但对病变内部结构显示不佳,纵隔窗对病变内部结构及纵隔结构显示清晰,但对病变的边缘及周围肺组织显示不佳。如图1所示,不同的窗口设置对病变的显示范围不同,在肺窗下病变的边缘、毛刺、磨玻璃等结构显示比纵隔窗要清晰,但对病变内部结构显示不如纵隔窗[9-11]。
本研究选用了5种不同的窗宽窗位:考虑到CT机扫描时及DICOM图像存储的CT值范围为-1024~3071 HU,换算成窗宽窗位为(4096,1024)(本研究称之为全窗),除了选择全窗和常规的肺窗(1500,-600)、纵隔窗(350,40)以外,还自定义了两个窗宽窗位:自定义窗口1(SW1)和自定义窗口2(SW2)。其中SW1由纵隔窗转换而来,本研究选择和纵隔窗相同的窗位(40),然后扩大窗宽为1000(在临床影像读片过程中,我们发现SW1在一定程度上可以兼顾观察到病灶的边缘和病变密度的差异)。SW2是SW1的类似转变,窗宽仍为1000,然后将窗位定为 -100(在临床影像读片过程中,我们发现肺内实性病变的CT值比软组织密度要低,因此将SW2的窗位定为 -100 HU,本研究认为SW2与SW1一样,可以在一定程度上兼顾观察到病灶的边缘和病变密度的差异)。
卷积神经网络是深度学习技术的一种模型,卷积神经网络的关键思想在于多层堆叠、局部连接、权值共享和池化,将单层的卷积神经网络进行多次堆叠,前一层的输出作为后一层的输入,便构成卷积神经网络;CNN中的层与层之间不再是全连接的,而是局部连接的,这样可以大大简化模型的复杂度,减少参数的数量[12-13]。CNN目前可以应用于胸部CT多个方面,包括肺组织分割、肺结节检测、肺部病变的分类等,网络结构也趋于3D化。本研究选择了3种3D CNN网络模型:ResNet、ResNext以及DenseNet,这3种网络均为深度学习常用网络结构。
本研究选择的3种神经网络之间的分类准确率及诊断效能没有太大差异,总体来说ResNext的性能稍差,DenseNet的性能稍好。在窗口设置方面,ResNet的平均分类准确率最低为纵隔窗85.732%,AUC值为0.871;平均分类准确率最高为全窗,达91.596%,AUC值为0.946。ResNext的平均分类准确率最低为纵隔窗81.528%,AUC值为0.814;平均分类准确率最高为全窗,达86.568%,AUC值为0.882。DenseNet的平均分类准确率最低为纵隔窗87.954%,AUC值为0.906;平均分类准确率最高为自定义窗口2,达93.274%,AUC值为0.951。本研究还将3种3D CNN的5种窗口下的ROC曲线进行了两两对比发现,纵隔窗与肺窗、纵隔窗与SW1、纵隔窗与SW2之间的AUC值比较均有统计学意义,而其余4种窗口设置之间结果大多没有显著差异,也就是说纵隔窗设置下的AUC值结果最差。根据公式,CT图像显示的强度范围为“窗位+1/2窗宽~窗位 -1/2窗宽”,可以计算出5个窗口设置下对应的的图像强度:肺窗[-1350,150];纵隔窗[-135,215];自定义窗口1(SW1)[-460,540];自定义窗口2(SW2)[-600,400];全窗图像的强度将保持原始范围[-1024,3071]。由于肺实性病变CT值约 -300~50 HU,磨玻璃病变CT值约 -700~-300 HU[14-15],由此可以发现全窗、肺窗及SW2这3种窗口设置能比较好的覆盖住肺实质以及病变的CT值范围,而纵隔窗和SW1这2种窗口设置并没有完全覆盖住如磨玻璃病变的CT值范围。而本研究结果也表明在纵隔窗下3D CNN的分类效果最差,我们认为其原因可能是在纵隔窗设置下,所覆盖的CT图像显示的强度范围窄,可能会去除一部分有价值的信息,而其他4种窗口下所覆盖的CT图像显示的强度范围相对来说能提供足够的信息。
然而由于本研究的样本量不大,窗口设置的选择以参考文献和临床经验为主,并且数据采集选用了不同机器,参数设置会有一定差异,此外还有待多中心的研究,进一步提高结果的可靠性。
总之,CT窗口设置对人工智能分类肺部病变结果有影响,不同的窗口设置下人工智能对肺部病变的分类准确率及诊断效能有差异,本研究认为在未来人工智能研究中应该适当加入CT窗技术的研究。
-
![]()
![]()
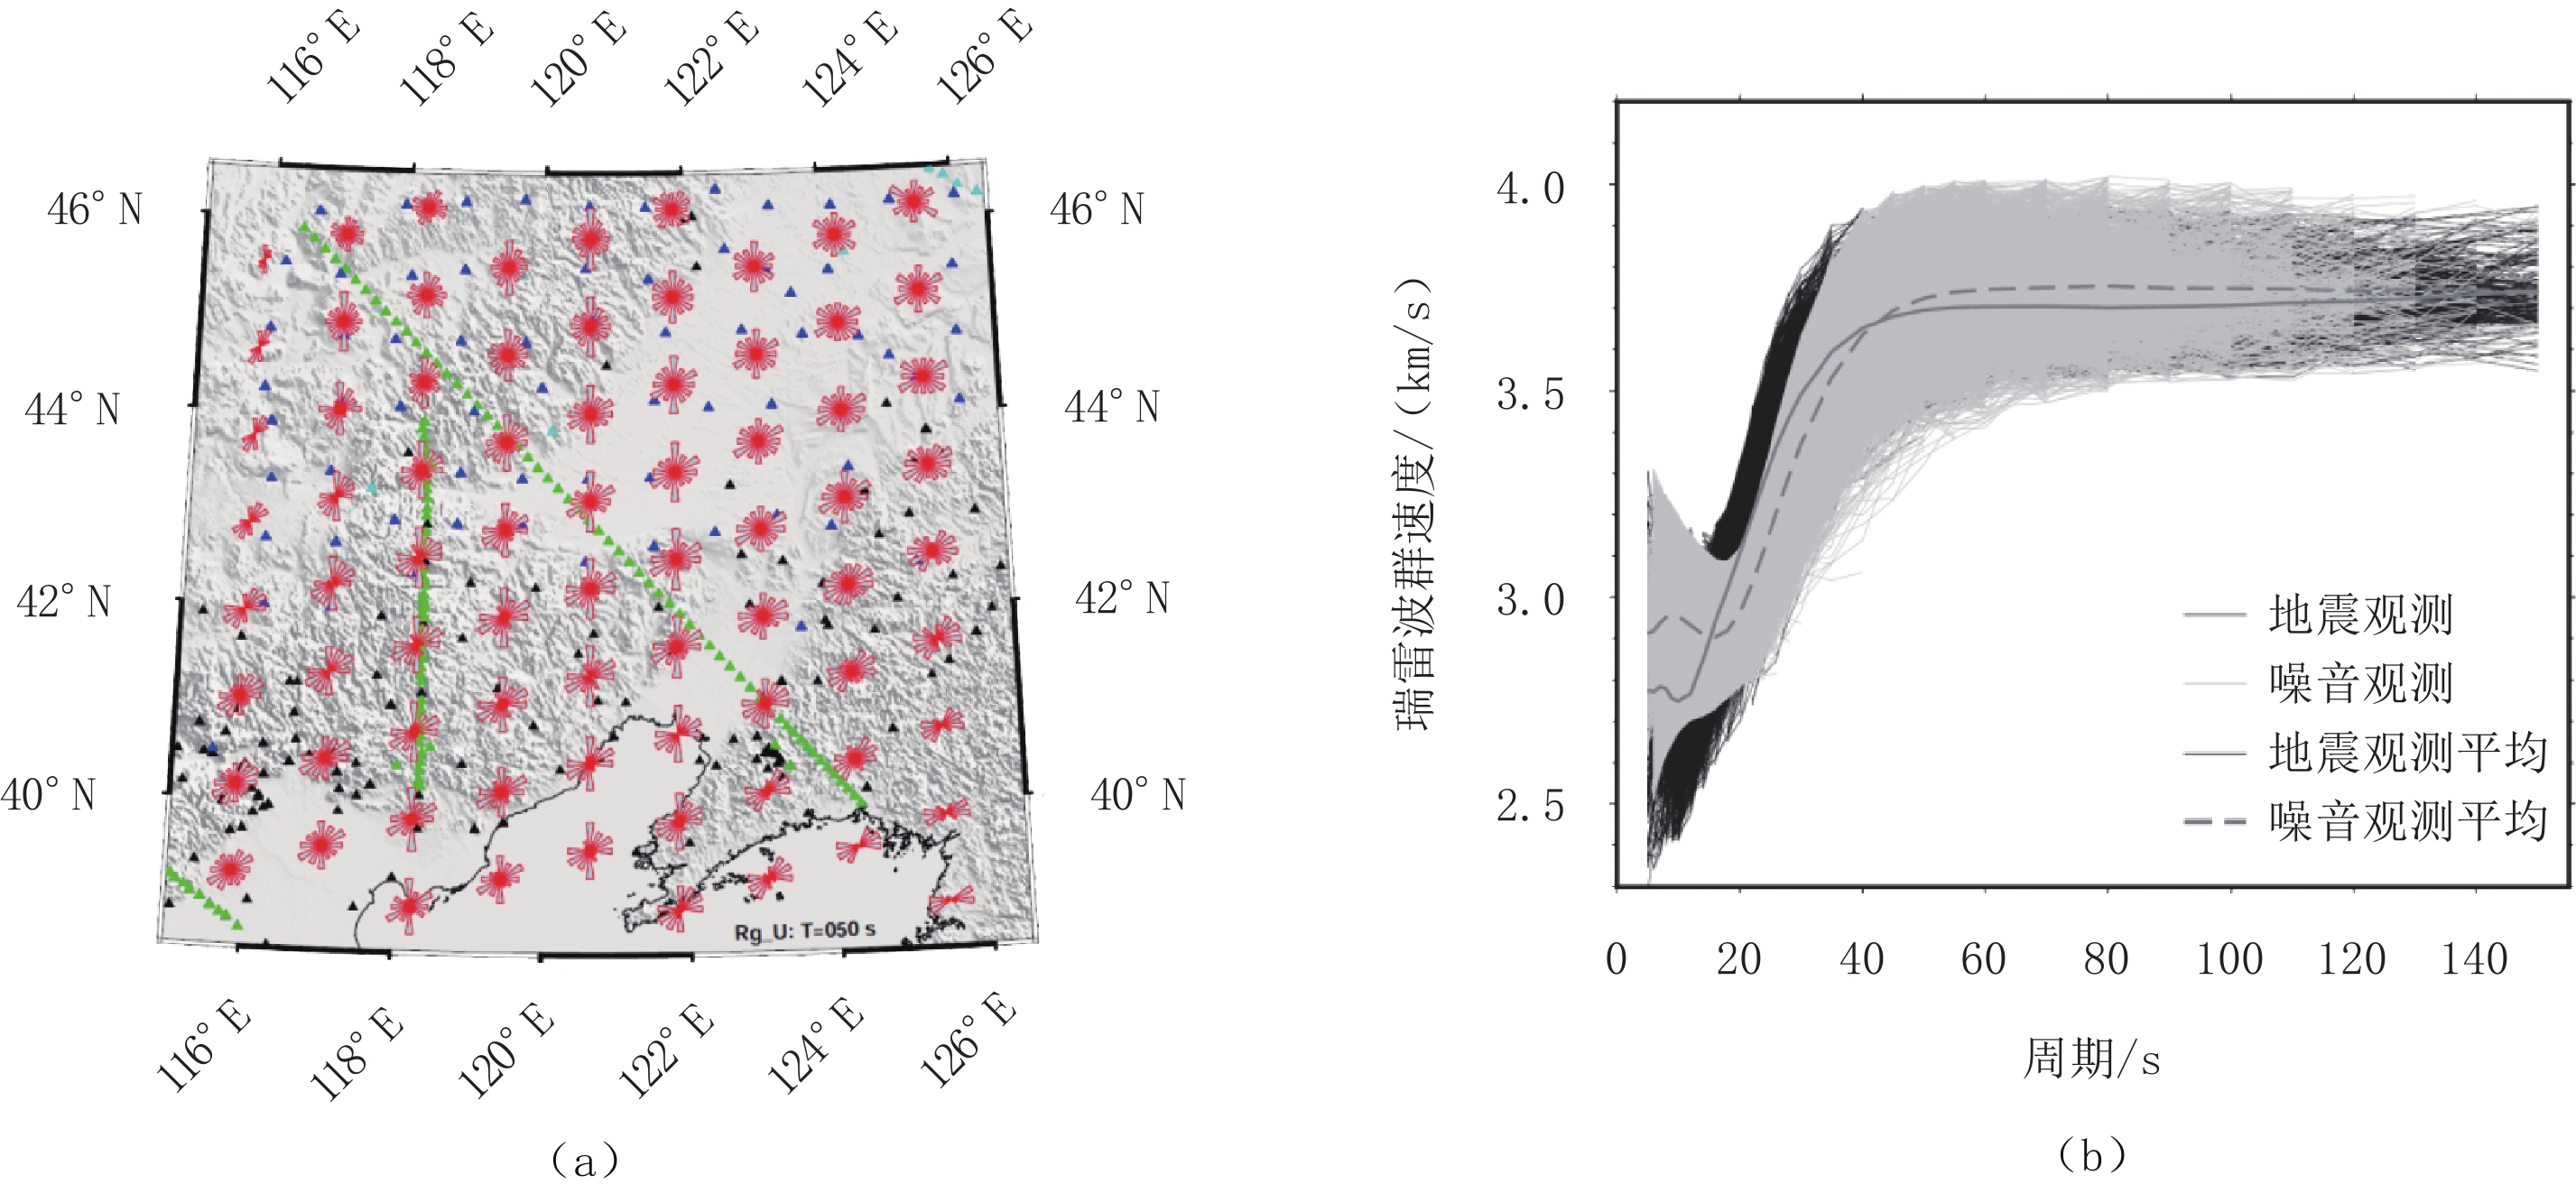
图 2 地震台站和数据分布情况
(a)地震台站(三角)以及50 s周期的数据方位分布(玫瑰图);(b)地震事件(细黑线)和环境噪音(细灰线)波频散观测及其区域平均(粗灰线、虚线)。玫瑰图中扇形半径与每30°方位间隔内的观测数量成正比;扇形半径越长,该方位观测数量越大;玫瑰图越接近于圆形,表示观测数据方位分布越均匀。
Figure 2. Seismic stations and data
![]()
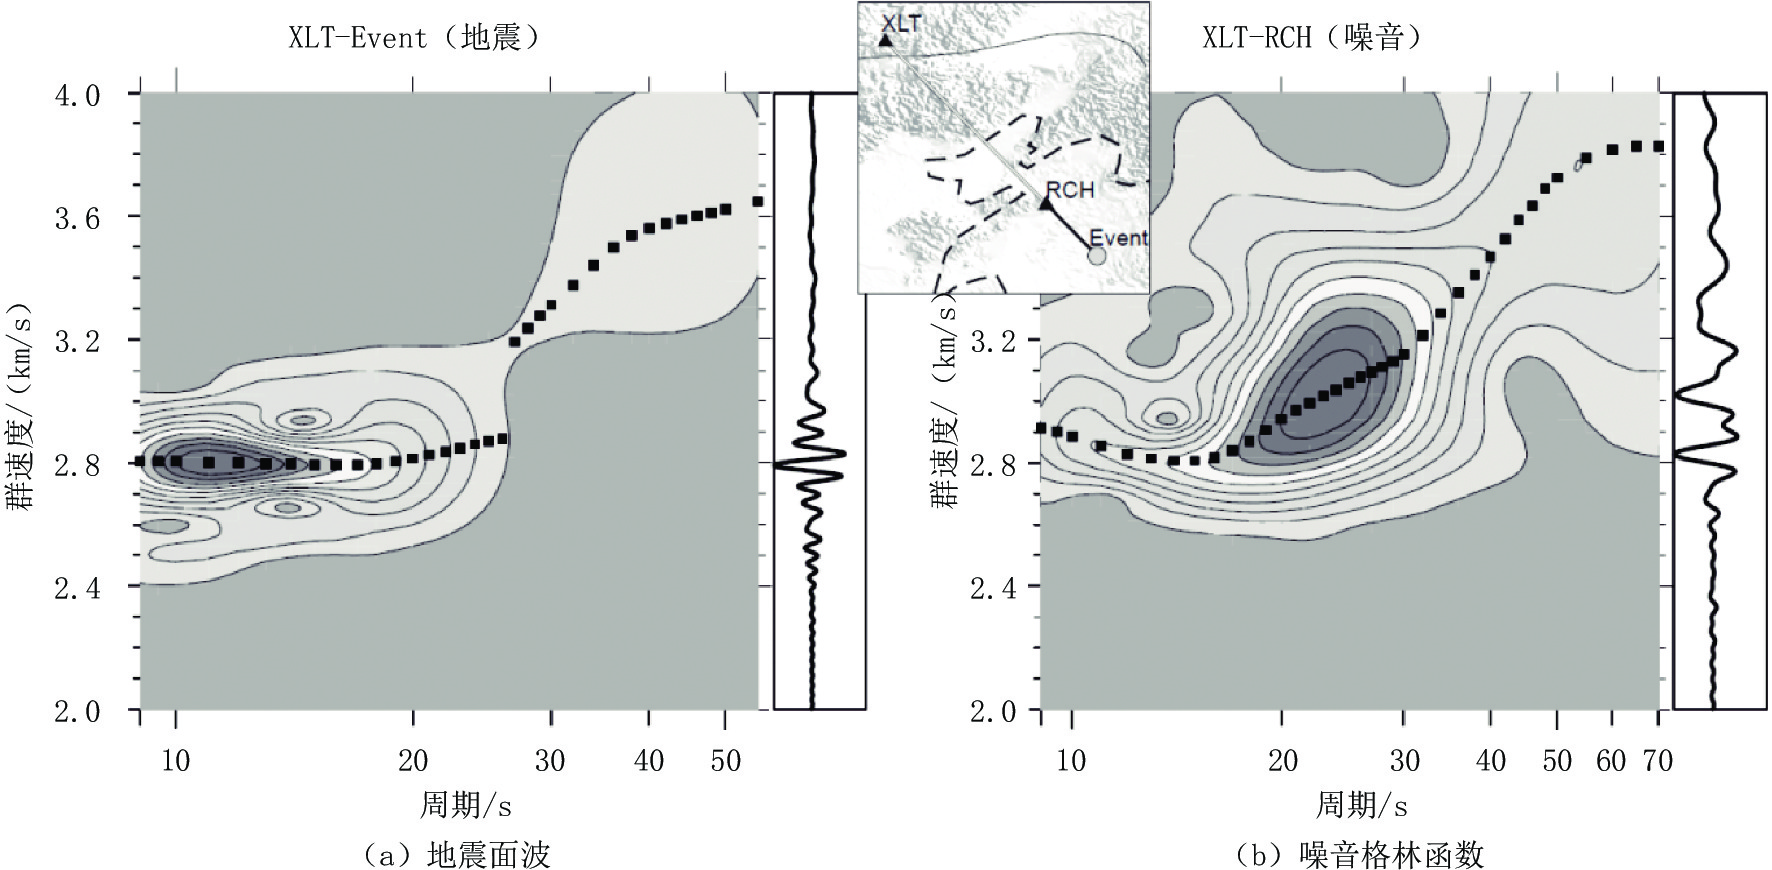
图 3 相似路径(插图)的地震面波(a)和噪音格林函数(b)时频分析实例
Figure 3. Example of group-velocity dispersion analysis for earthquake surface wave (a) and noise Green’s function (b) with similar travelling paths (inset map)
![]()
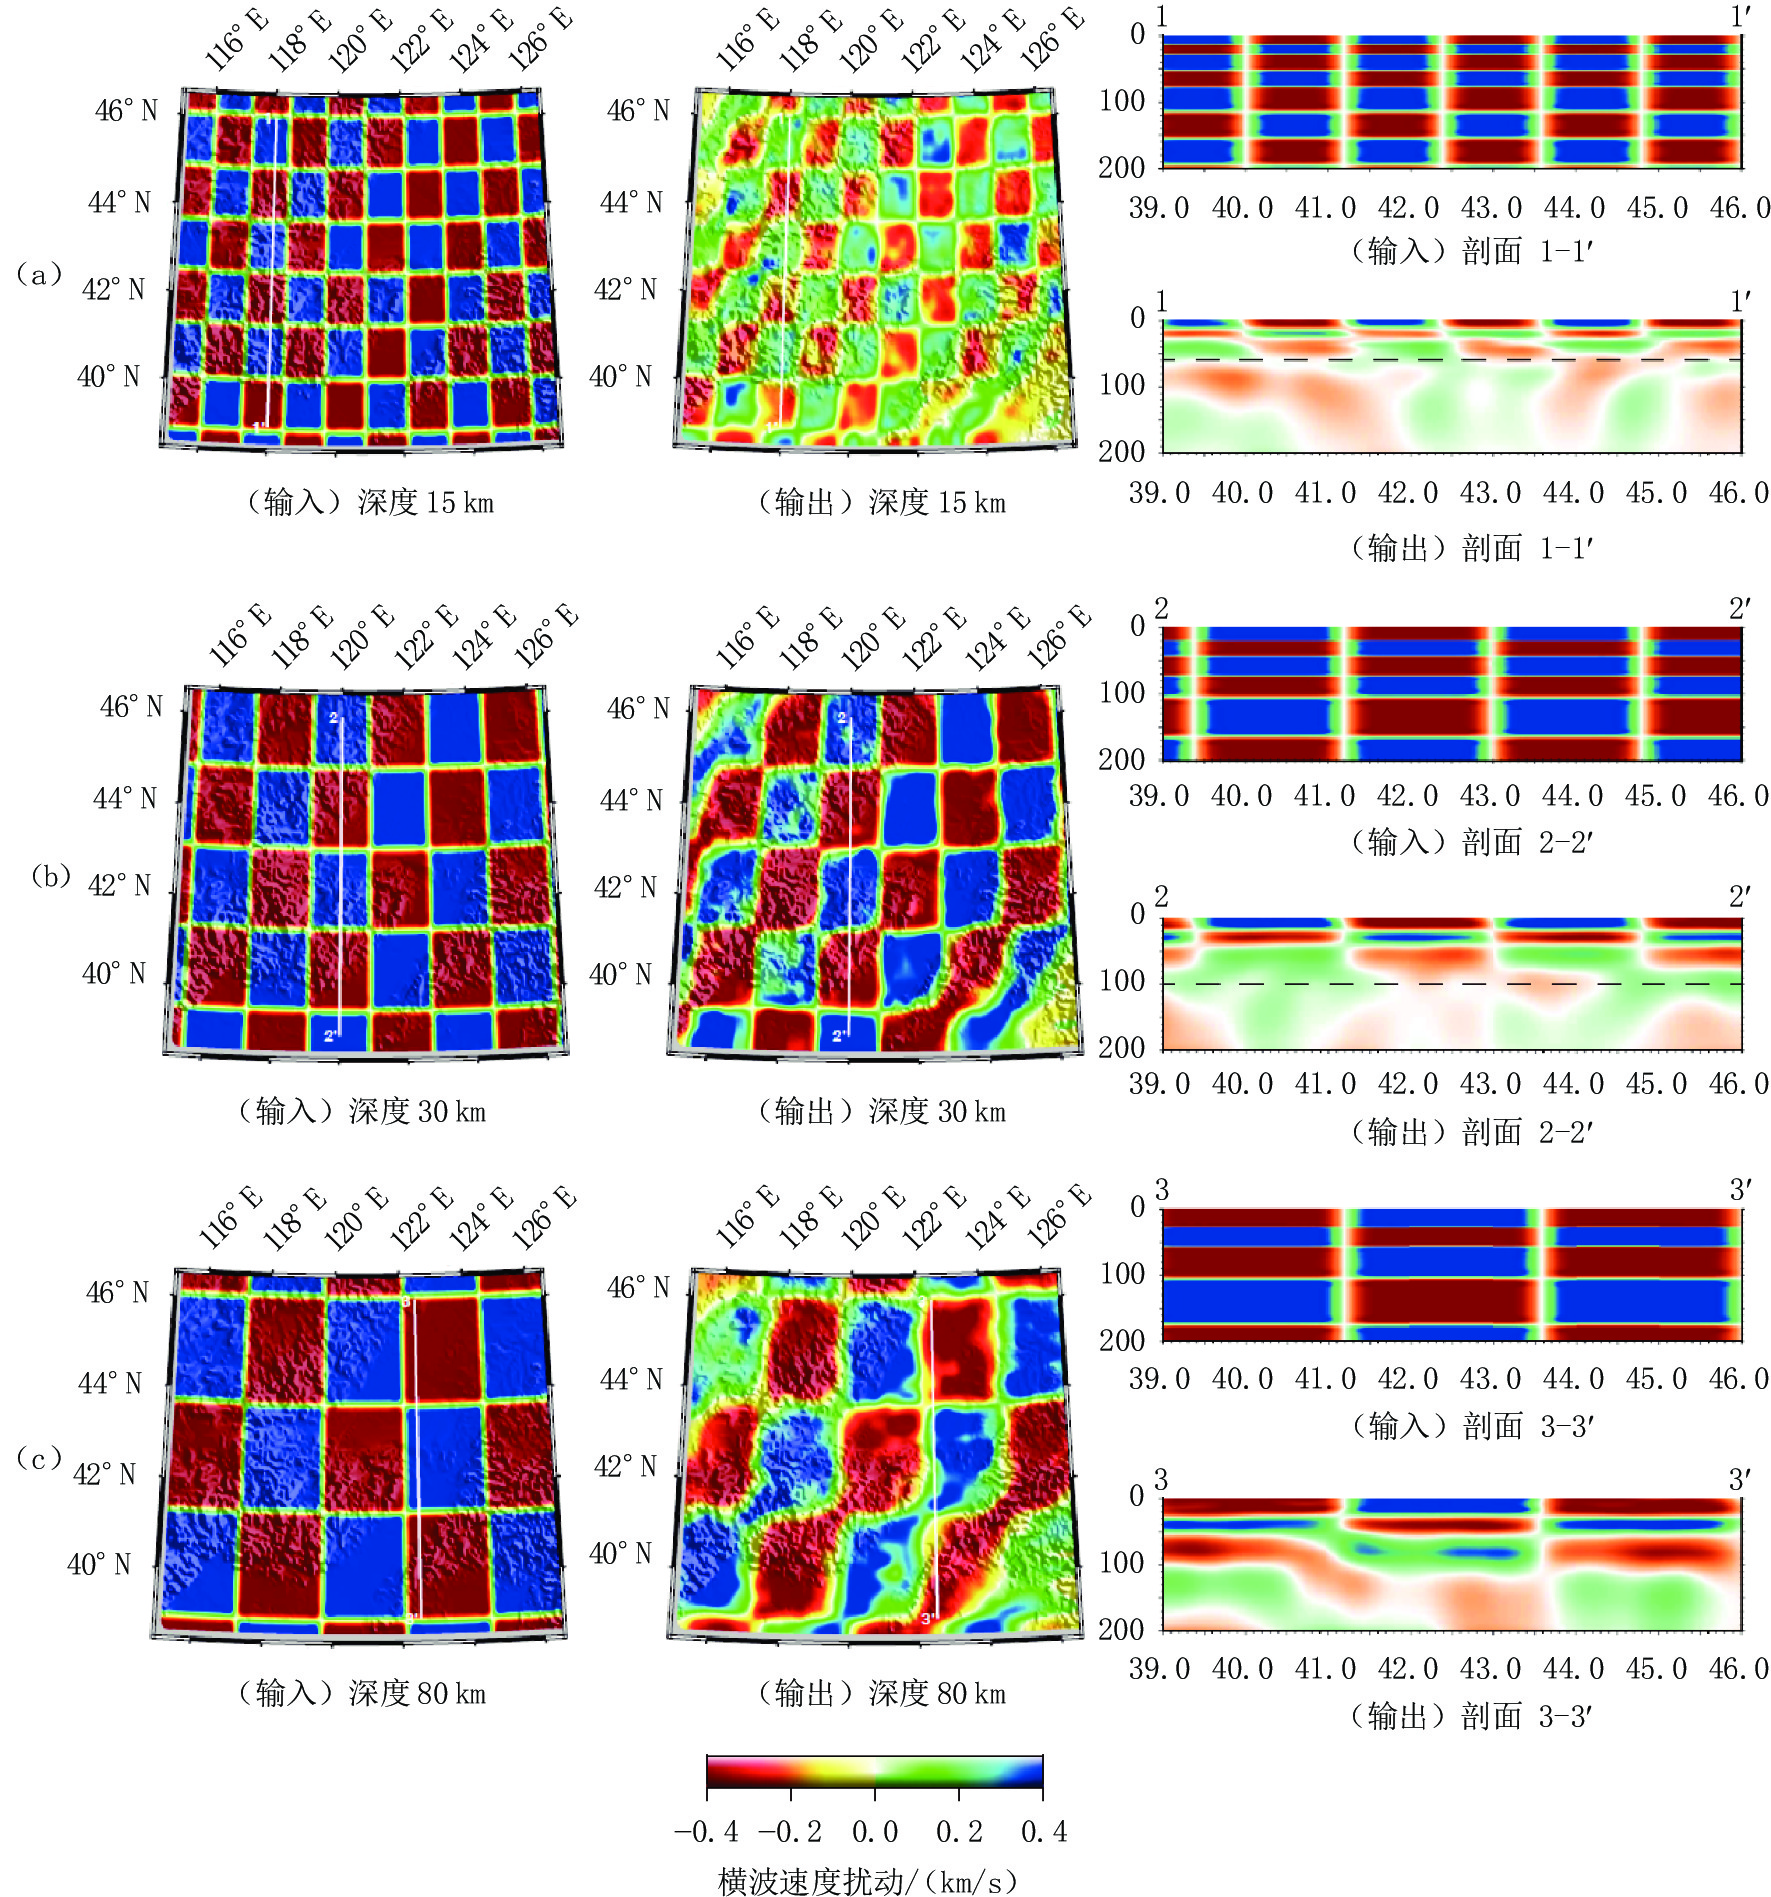
图 4 三维检测板分辨率测试结果
(a)异常尺寸为1.2°×1.2°×(15~40 km);(b)异常尺寸为1.8°×1.8°×(20~60 km);(c)检测板尺寸为2.4°×2.4°×(30~70 km)。注为“深度”和“剖面”的子图分别表示不同深度水平切片和穿过不同剖面的垂直切片。水平切片中白线为相应垂直剖面位置。
Figure 4. Results of 3D checkerboard resolution tests
-
[1] FU W, HOU H S, GAO R, et al. Lithospheric structures of the central Solonker-Xar Moron-Changchun-Yanji suture (Inner Mongolia) revealed by a deep seismic reflection profile[J]. Tectonophysics, 2021, 817: 229043. doi: 10.1016/j.tecto.2021.229043
[2] LIU Y J, LI W M, FENG Z Q, et al. A review of the Paleozoic tectonics in the eastern part of Central Asian Orogenic Belt[J]. Gondwana Research, 2017, 43: 123−148. doi: 10.1016/j.gr.2016.03.013
[3] WILDE S A. Final amalgamation of the Central Asian Orogenic Belt in NE China: Paleo-Asian Ocean closure versus Paleo-Pacific plate subduction: A review of the evidence[J]. Tectonophysics, 2015, 662: 345−362. doi: 10.1016/j.tecto.2015.05.006
[4] 潘桂棠, 肖庆辉, 陆松年, 等. 中国大地构造单元划分[J]. 中国地质, 2009,36(1): 1−28. doi: 10.3969/j.issn.1000-3657.2009.01.001 PAN G T, XIAO Q H, LU S N, et al. Subdivision of tectonic units in China[J]. Geology in China, 2009, 36(1): 1−28. (in Chinese). doi: 10.3969/j.issn.1000-3657.2009.01.001
[5] ZHU R X, XU Y G. The subduction of the West Pacific plate and the destruction of the North China Craton[J]. Science China Earth Sciences, 2019, 62: 1340−1350. doi: 10.1007/s11430-018-9356-y
[6] GUO Z, WANG K, YANG Y J, et al. The origin and mantle dynamics of quaternary intraplate volcanism in Northeast China from joint inversion of surface wave and body wave[J]. Journal of Geophysical Research, 2018, 123(3): 2410−2425. doi: 10.1002/2017JB014948
[7] TANG Y C, OBAYASHI M, NIU F L, et al. Changbaishan volcanism in Northeast China linked to subduction-induced mantle upwelling[J]. Nature Geoscience, 2014, 7(6): 470−475. doi: 10.1038/ngeo2166
[8] LU M W, LEI J S, ZHAO D P, et al. SKS Splitting measurements in NE China: New insights into the Wudalianchi intraplate volcanism and mantle dynamics[J]. Journal of Geophysical Research, 2020, 125(3): e2019JB018575.
[9] FAN X L, CHEN Q F. Seismic constraints on the magmatic system beneath the Changbaishan volcano: Lnsight into its origin and regional tectonics[J]. Journal of Geophysical Research, 2019, 124(2): 2003−2024. doi: 10.1029/2018JB016288
[10] DENG Y F, XU Y G, CHEN Y. Formation mechanism of the North-South gravity lineament in Eastern China[J]. Tectonophysics, 2021, 818: 229074. doi: 10.1016/j.tecto.2021.229074
[11] CHEN L, JIANG M M, YANG J H, et al. Presence of an intralithospheric discontinuity in the central and western North China Craton: Implications for destruction of the craton[J]. Geology, 2014, 42(3): 223−226. doi: 10.1130/G35010.1
[12] CHEN L. Lithospheric structure variations between the eastern and central North China Craton from S- and P-receiver function migration[J]. Physics of The Earth and Planetary Interiors, 2009, 173(3): 216−227.
[13] CHEN L, TAO W, ZHAO L, et al. Distinct lateral variation of lithospheric thickness in the Northeastern North China Craton[J]. Earth and Planetary Science Letters, 2008, 267: 56−68. doi: 10.1016/j.jpgl.2007.11.024
[14] ZHAO L, ZHENG T Y, CHEN L, et al. Shear wave splitting in Eastern and Central China: Implications for upper mantle deformation beneath continental margin[J]. Physics of The Earth and Planetary Interiors, 2007, 162: 73−84. doi: 10.1016/j.pepi.2007.03.004
[15] ZHENG T Y, ZHU R X, ZHAO L, et al. Intralithospheric mantle structures recorded continental subduction[J]. Journal of Geophysical Research, 2012, 117(B3).
[16] ZHENG T Y, HE Y M, YANG J H, et al. Seismological constraints on the crustal structures generated by continental rejuvenation in Northeastern China[J]. Scientific Reports, 2015, 5(1): 14995. doi: 10.1038/srep14995
[17] FENG M, ASSUMPÇÃO MARCELO S, Van der LEE S. Group-velocity tomography and lithospheric S-velocity structure of the South American continent[J]. Physics of The Earth and Planetary Interiors, 2004, 147(4): 315−331. doi: 10.1016/j.pepi.2004.07.008
[18] 中国地震科学台阵. 中国地震科学探测台阵波形数据[DB/OL]. 中国地震局, 2006. DOI: 10.12001/ChinArray.Data. ChinArray. China seismic array waveform data[DB/OL]. China Earthquake Administration, 2006. DOI://10.12001/ChinArray.Data. (in Chinese).
[19] 中国地震局地球物理研究所国家测震台网数据备份中心. 地震波形数据[DB/OL]. 中国地震局. DOI: 10.11998/SeisDmc/SN. [20] TANG Q S, CHEN L. Structure of the crust and uppermost mantle of the Yanshan Belt and adjacent regions at the northeastern boundary of the North China Craton from Rayleigh wave dispersion analysis[J]. Tectonophysics, 2008, 455(1): 43−52.
[21] 危自根, 陈凌, 杨小林. 辽东台隆、燕山带和兴蒙造山带台站下方地壳厚度和平均波速比(Vp/Vs)的横向变化及其构造意义[J]. 地球物理学报, 2011,54(11): 2799−2808. doi: 10.3969/j.issn.0001-5733.2011.11.010 WEI Z G, CHEN L, YANG X L. Transverse variations of crustal thickness and VP/VS ratio under the stations in the Liaodong anteclise-Yanshan belt-Xingmeng orogenic belt and their tectonic implications[J]. Chinese Journal of Geophysics, 2011, 54(11): 2799−2808. (in Chinese). doi: 10.3969/j.issn.0001-5733.2011.11.010
[22] ZHANG R Q, WU Q J, SUN L, et al. Crustal and oblithospheric structure of Northeast China from S-wave receiver functions[J]. Earth and Planetary Science Letters, 2014, 401: 196−205. doi: 10.1016/j.jpgl.2014.06.017
[23] 张广成, 吴庆举, 潘佳铁, 等. 利用H-K叠加方法和CCP叠加方法研究中国东北地区地壳结构与泊松比[J]. 地球物理学报, 2013,56(12): 4084−4094. DOI: 10.6038/cjg20131213. ZHANG G C, WU Q J, PAN J T, et al. Study of crustal structure and Poisson ratio of NE China by H-K stack and CCP stack methods[J]. Chinese Journal of Geophysics, 2013, 56(12): 4084−4094. DOI: 10.6038/cjg20131213. (in Chinese).
[24] TAO K, NIU F L, NING J Y, et al. Crustal structure beneath NE China imaged by NECESSArray receiver function data[J]. Earth and Planetary Science Letters, 2014, 398: 48−57. doi: 10.1016/j.jpgl.2014.04.043
[25] BENSEN G D, RITZWOLLER M H, BARMIN M P, et al. Processing seismic ambient noise data to obtain reliable broad-band surface wave dispersion measurements[J]. Geophysical Journal International, 2007, 169(3): 1239−1260. doi: 10.1111/j.1365-246X.2007.03374.x
[26] HERRMANN R B. Computer programs in seismology: An evolving tool for instruction and research[J]. Seismological Research Letters, 2013, 84(6): 1081−1088. doi: 10.1785/0220110096
[27] SHAPIRO N M, RITZWOLLER M H. Monte-Carlo inversion for a global shear-velocity model of the crust and upper mantle[J]. Geophysical Journal International, 2002, 151: 88−105. doi: 10.1046/j.1365-246X.2002.01742.x
[28] 黄忠贤, 李红谊, 胥颐. 南北地震带岩石圈S波速度结构面波层析成像[J]. 地球物理学报, 2013,56(4): 1121−1131. DOI: 10.6038/cjg20130408. HUANG Z X, LI H Y, XU Y. Lithospheric S-wave velocity structure of the North-South seismic belt of China from surface wave tomography[J]. Chinese Journal of Geophysics, 2013, 56(4): 1121−1131. DOI: 10.6038/cjg20130408. (in Chinese).
[29] 苏伟, 彭艳菊, 郑月军, 等. 青藏高原及其邻区地壳上地幔S波速度结构[J]. 地球学报, 2002,23(3): 193−200. doi: 10.3321/j.issn:1006-3021.2002.03.001 SU W, PENG Y J, ZHENG Y J, et al. Crust and upper mantle shear velocity structure beneath the Tibetan Plateau and adjacent areas[J]. Acta Geoscientica Sinica, 2002, 23(3): 193−200. (in Chinese). doi: 10.3321/j.issn:1006-3021.2002.03.001
[30] LEVENBERG K. A method for the solution of certain nonlinear problems in least squares[J]. Quarterly of Applied Mathematics, 1944, 2: 164−168. doi: 10.1090/qam/10666
[31] TIKHONOV A N. On the solution of ill-posed problems and the method of regularization[J]. Doklady Akademii Nauk SSSR, 1963, 151(3): 501−504.
[32] FENG M, AN M J. Lithospheric structure of the Chinese mainland determined from joint inversion of regional and teleseismic Rayleigh-wave group velocities[J]. Journal of Geophysical Research, 2010, 115: B06317.
[33] AN M J, WIENS D A, ZHAO Y, et al. S-velocity model and inferred Moho topography beneath the Antarctic plate from Rayleigh waves[J]. Journal of Geophysical Research, 2015, 120(1): 359−383. doi: 10.1002/2014JB011332
[34] FENG M, AN M J, MECHIE J, et al. Lithospheric structures of and tectonic implications for the central-east Tibetan plateau inferred from joint tomography of receiver functions and surface waves[J]. Geophysical Journal International, 2020, 223(3): 1688−1707. doi: 10.1093/gji/ggaa403
[35] 冯梅, 安美建. 基于面波频散的三维横波速度方位各向异性层析成像方法[J]. CT理论与应用研究, 2020,29(4): 381−397. DOI: 10.15953/j.1004-4140.2020.29.04.01. FENG M, AN M J. Method on 3D tomography of S-wave velocity azimuthal anisotropy by using surface-wave dispersion curves[J]. CT Theory and Applications, 2020, 29(4): 381−397. DOI: 10.15953/j.1004-4140.2020.29.04.01. (in Chinese).
[36] GASS S I, FU M C. Newton’s method[M]. Boston, MA: Encyclopedia of Operations Research and Management Science, Springer US, 2013: 1051-1051.
[37] MOROZOV V A. Methods for solving incorrectly posed problems[M]. New York: Springer-Verlag, 1984: 1-257.
[38] AN M J. Adaptive regularization of the reference model in an inverse problem[J]. Pure and Applied Geophysics, 2020, 177(10): 4943−4956. doi: 10.1007/s00024-020-02530-z
[39] LASKE G, MA Z T, MASTERS G, et al. A new global crustal model at 1×1 degrees[OL]. http://igppweb.ucsd.edu/~gabi/crust1.html, 2012.
[40] KENNETT B L N, ENGDAHL E R. Traveltimes for global earthquake location and phase identification[J]. Geophysical Journal International, 1991, 105: 429−465. doi: 10.1111/j.1365-246X.1991.tb06724.x
[41] 查小惠, 吕坚, 鲍志诚, 等. 接收函数H-k叠加方法研究综述[J]. CT理论与应用研究, 2020,29(3): 369−379. DOI: 10.15953/j.1004-4140.2020.29.03.14. ZHA X H, LV J, BAO Z C, et al. A review of H-k stack method of receiver function[J]. CT Theory and Applications, 2020, 29(3): 369−379. DOI: 10.15953/j.1004-4140.2020.29.03.14. (in Chinese).
[42] 安美建, 冯梅, 赵琳. 地震层析成像中的不确定性[J]. CT理论与应用研究, 2009,18(2): 24−32. AN M J, FENG M, ZHAO L. Uncertainties in seismic tomography[J]. CT Theory and Applications, 2009, 18(2): 24−32. (in Chinese).
[43] 冯梅, 安美建. 反演模型分辨率的估算方法[J]. CT理论与应用研究, 2013,22(4): 587−604. doi: 10.3969/j.issn.1004-4140.2013.04.003 FENG M, AN M J. How to determine spatial resolution for an inverse problem[J]. CT Theory and Applications, 2013, 22(4): 587−604. (in Chinese). doi: 10.3969/j.issn.1004-4140.2013.04.003
[44] LI Y H, GAO M T, WU Q J. Crustal thickness map of the Chinese mainland from teleseismic receiver functions[J]. Tectonophysics, 2014, 611: 51−60. doi: 10.1016/j.tecto.2013.11.019
[45] HE R Z, SHANG X F, YU C Q, et al. A unified map of Moho depth and Vp/Vs ratio of continental China by receiver function analysis[J]. Geophysical Journal International, 2014, 199(3): 1910−1918. doi: 10.1093/gji/ggu365
[46] FENG M, AN M J, DONG S W. Tectonic history of the ordos block and Qinling orogen inferred from crustal thickness[J]. Geophysical Journal International, 2017, 210(1): 303−320. doi: 10.1093/gji/ggx163
[47] FENG M, AN M J, Van der LEE S. Region-related features of crustal and upper-mantle velocity structure of the Chinese mainland detected by surface waveform modeling[J]. Acta Seismologica Sinica, 2008, 21(2): 118−126. doi: 10.1007/s11589-008-0003-0
[48] 中国地质调查局. 中华人民共和国1︰250万数字地质图说明书[M]. 北京: 中国地图出版社, 2004. China Geological Survey. 1︰2 500 000 geological map of China[M]. Beijing: China Cartographic Publishing House, 2004. (in Chinese).
[49] SONG Y, STEPASHKO A, LIU K Y, et al. Post-rift tectonic history of the Songliao basin, NE China: Cooling events and post-rift unconformities driven by orogenic pulses from plate boundaries[J]. Journal of Geophysical Research, 2018, 123(3): 2363−2395. doi: 10.1002/2017JB014741
[50] 冯梅, 安美建. 中国大陆中上地壳剪切波速结构[J]. 地震学报, 2007,20(4): 359−369. doi: 10.3321/j.issn:0253-3782.2007.04.001 FENG M, AN M J. Middle and upper crust shear-wave velocity structure of the Chinese mainland[J]. Acta Seismologica Sinica, 2007, 20(4): 359−369. (in Chinese). doi: 10.3321/j.issn:0253-3782.2007.04.001
[51] 高延光, 李永华. 中国东北-华北地区地壳厚度与泊松比及其地质意义[J]. 地球物理学报, 2014,57(2): 166−176. doi: 10.1002/cjg2.20094 GAO Y G, LI Y H. Crustal thickness and Vp/Vs in the Northeast China-North China region and its geological implication[J]. Chinese Journal of Geophysics, 2014, 57(2): 166−176. (in Chinese). doi: 10.1002/cjg2.20094
[52] 张凯文, 陈棋福, 陈赟. 接收函数揭示的兴蒙造山带西南部的地壳结构特征[J]. 地球物理学报, 2020,63(4): 1−21. doi: 10.6038/cjg2020N0048 ZHANG K W, CHEN Q F, CHEN Y. Crustal structure beneath the southwestern Xing’an-Mongolia orogenic belt revealed by receiver function analysis[J]. Chinese Journal of Geophysics, 2020, 63(4): 1−21. (in Chinese). doi: 10.6038/cjg2020N0048
[53] AN M J, SHI Y L. Lithospheric thickness of the Chinese continent[J]. Physics of The Earth and Planetary Interiors, 2006, 159: 257−266. doi: 10.1016/j.pepi.2006.08.002
[54] HE Y, CHEN Q F, CHEN L, et al. Distinct lithospheric structure in the Xing'an-Mongolian orogenic belt (submitted)[J]. Geophysical Research Letters, 2022.
[55] ENGDAHL E R, Van der HILST R D, BULAND R. Global teleseismic earthquake relocation with improved travel times and procedures for detph determination[J]. Bulletin of the Seismological Society of America, 1998, 88: 722−743.
[56] FREDERIKSEN A W, BOSTOCK M G, CASSIDY J F. S-wave velocity structure of the Canadian upper mantle[J]. Physics of the Earth and Planetary Interiors, 2001, 124: 175−191. doi: 10.1016/S0031-9201(01)00194-7
[57] Van der LEE S. High-resolution estimates of lithosphere thickness from Missouri to Massachusetts, USA[J]. Earth and Planetary Science Letters, 2002, 203: 15−23. doi: 10.1016/S0012-821X(02)00846-4
[58] 朱介寿, 曹家敏, 蔡学林, 等. 东亚及西太平洋边缘海高分辨率面波层析成像[J]. 地球物理学报, 2002,45(5): 646−664. doi: 10.3321/j.issn:0001-5733.2002.05.007 ZHU J S, CAO J M, CAI X L, et al. High resolution surface wave tomography in East Asia and West Pacific marginal seas[J]. Chinese Journal of Geophysics, 2002, 45(5): 646−664. (in Chinese). doi: 10.3321/j.issn:0001-5733.2002.05.007
[59] ZHU J S, CAI X L, CAO J M, et al. Lithospheric structure and geodynamics in China and its adjacent areas[J]. Geology in China, 2006, 33(4): 793−802.
[60] HUANG X A, BI Z W, DEPAOLO D J. Sm-Nd isotope study of early Archean rocks, Qianan, Hebei Province, China[J]. Geochimica et Cosmochimica Acta, 1986, 50(4): 625−631. doi: 10.1016/0016-7037(86)90111-0
[61] ZHAO G C, WILDE S A, CAWOOD P A, et al. Archean blocks and their boundaries in the North China Craton: Lithological, geochemical, structural and P-T path constraints and tectonic evolution[J]. Precambrian Research, 2001, 107(1): 45−73.
-
期刊类型引用(1)
1. 李梦雨,段诗苗,张雷,周咏春. 提高肺SBRT精度的多窗位动态组合诊疗手段. 中国CT和MRI杂志. 2024(04): 63-65 .  百度学术
百度学术
其他类型引用(1)

 下载:
下载:


计量
- 文章访问数: 570
- HTML全文浏览量: 194
- PDF下载量: 80
- 被引次数: 2


