
Evaluation of the Invasion of Pulmonary Subsolid Nodules by the Artificial Intelligence Volumetric Density Method
-
摘要: 目的:探讨人工智能(AI)体积密度法判断肺亚实性结节(SSNs)浸润性的价值。方法:回顾性分析106例患者的108枚SSNs的CT和病理结果,将结节分为腺体前驱病变组和腺癌组。通过肺结节AI软件测量并比较两组的最大CT值、最小CT值、平均CT值、峰度、偏度、Perc.25%、Perc.50%、Perc.75%、Perc.95%、结节体积、结节平均径等CT定量参数。使用Medcalc软件得出受试者工作特征曲线(ROC),评价诊断SSNs浸润性的敏感度、特异度、阳性预测值及阴性预测值,用逻辑回归分析评估他们的诊断性能。结果:SSNs的多数CT定量参数差异存在统计学意义,其中,诊断效能最高的是Perc.25%,AUC达0.797;其次为Perc.50% 和平均CT值,AUC均为0.787。Logistic回归分析显示,将诊断效能最高的Perc.25% 分别与Perc.50% 和平均CT值两两建立联合诊断模型1,其中Perc.25% 与平均CT值的模型诊断效能最高,且联合诊断模型诊断效能高于Perc.25% 与平均CT值单独的诊断效能。Medcalc软件分析显示,Perc.25%≥-578 HU和平均CT值≥-468 HU的SSNs病理表现为腺癌的可能性大。将Perc.25% 与结节平均径结合,可获得对判断SSNs浸润性非常有价值的联合诊断模型2。结论:AI体积密度法对SSNs的浸润性有较高的诊断价值,联合使用Perc.25% 与平均CT值比单独使用更能准确地判断浸润性。Abstract: Objective: To explore the value of the artificial intelligence (AI) volumetric density method in determining the invasion of pulmonary hyposolid nodules (SSNs). Methods: A total of 108 SSNs and the pathological results of 106 patients were reviewed, and these were divided into a glandular prodromal lesions group and an adenocarcinoma group. Pulmonary nodule AI software was used to measure and compare the CT quantitative parameters of the two groups, including the maximum CT value, minimum CT value, average CT value, kurtosis, skewness, Perc.25%, Perc.50%, Perc.75%, Perc.90%, nodule volume, and mean nodule diameter. Moreover, a receiver operating characteristic curve (ROC) was obtained by MedCalc software to evaluate the sensitivity, specificity, positive predictive value, and negative predictive value for the diagnosis of SSN infiltration, and their diagnostic performance was evaluated by logistic regression analysis. Results: There were significant differences in most CT quantitative parameters of SSNs. The highest diagnostic efficiency was Perc.25% and the AUC was 0.797, while the AUC was 0.787 for Perc.50% and the mean CT value. Logistic regression analysis showed that Perc.25% with the highest diagnostic efficiency was combined with Perc.50% and the mean CT value. The model with Perc.25% and the mean CT value had the highest diagnostic efficiency, and the combined diagnostic model had a higher diagnostic efficiency than Perc.25% and the mean CT value alone. According to MedCalc software, SSNs with Perc.25% ≥−578 HU and mean CT values ≥ −468 HU were more likely to be in the adenocarcinoma group. In this study, Perc.25% was combined with the mean diameter of nodules, and a very valuable combined diagnostic model II was obtained to judge the infiltration of SSNs. Conclusion: The AI volume density method has a high diagnostic value for SSN invasion. Moreover , the combination of Perc.25% and mean CT value can accurately judge the invasion than the use of average CT value alone, providing a quantitative basis for the clinical management of SSNs.
-
Keywords:
- CT /
- artificial intelligence /
- volume density method /
- pulmonary subsolid nodules
-
肺癌已经成为世界各地癌症患者死亡的主要原因[1]。近年来,肺亚实性结节(subsolid nodules,SSNs)的检出率逐年增高,SSNs经常和肺腺癌有关[2]。由于不同病理阶段的SSNs的临床预后及治疗策略不同,因此术前影像学评估SSNs的侵袭程度对临床决策具有重要的意义[3-4]。以往对SSNs的大小测量多以最大横截面的最大横径来代表SSNs大小,以手动勾画感兴趣区内的平均CT值代表结节密度[5-8]。
本研究根据2021年WHO肺腺癌新分类标准,分为腺体前驱病变组(非典型腺瘤样增生(atypical adenomatous hyperplasia,AAH)、原位腺癌(adenocarcinoma in situ,AIS))和腺癌组(微浸润性腺癌(minimally invasive adenocarcinoma,MIA)、浸润性腺癌(invasive adenocarcinoma,IAC)),利用一款可以测量肺结节体积密度的人工智能(artificial intelligence,AI)分析软件,对病灶进行三维定量分析;利用AI体积密度法绘制CT值分布直方图,获得体积密度系列参数,探讨AI体积密度法判断肺亚实性结节浸润性的价值。
1. 材料与方法
1.1 研究对象
收集2013年1月至2022年4月于我院收治,有完整术前胸部CT、临床资料并经病理证实的108枚SSNs。根据2021年WHO肺腺癌新分类标准,分为腺体前驱病变组25例,包括AAH 3例、AIS 22例;腺癌组83例,包括MIA 16例、IAC 67例。
纳入标准:①肺内至少 1个 SSN,大小范围为0.5~3 cm之间;②在我院行手术切除,术后病理结果经复阅证实为AAH、AIS、MIA及IAC;③具有完整 CT图像、临床和病理数据。排除标准:①术后病理证明为良性疾病或其他肺癌的病理亚型;②患者有肺部多发转移瘤或其他部位原发肿瘤;③患者曾行全身化疗。
1.2 设备与参数采集
指导患者呼吸训练后,仰卧位进行胸部CT平扫。采用GE LightSpeed VCT及宝石CT、西门子SOMATOM Definition Flash双源CT、东芝Aquilion ONE 320排CT进行扫描。扫描参数:①GE LightSpeed VCT及宝石CT:管电压120 kV,自动管电流,层厚5 mm,重建层厚1.25 mm,螺距1.0,显示野(FOV)360 mm;②SOMATOM Definition Flash双源CT:管电压120 kV,自动管电流,层厚5 mm,重建层厚1 mm,螺距1,显示野(FOV)400 mm;③Aquilion ONE 320排CT:管电压120 kV,自动管电流,层厚5 mm,重建层厚0.8 mm,螺距0.516,显示野(FOV)400 mm。
扫描矩阵512×512,并采用肺高分辨算法进行重建(图1)。将扫描得到的原始数据上传至AI肺结节筛查系统进行观察。
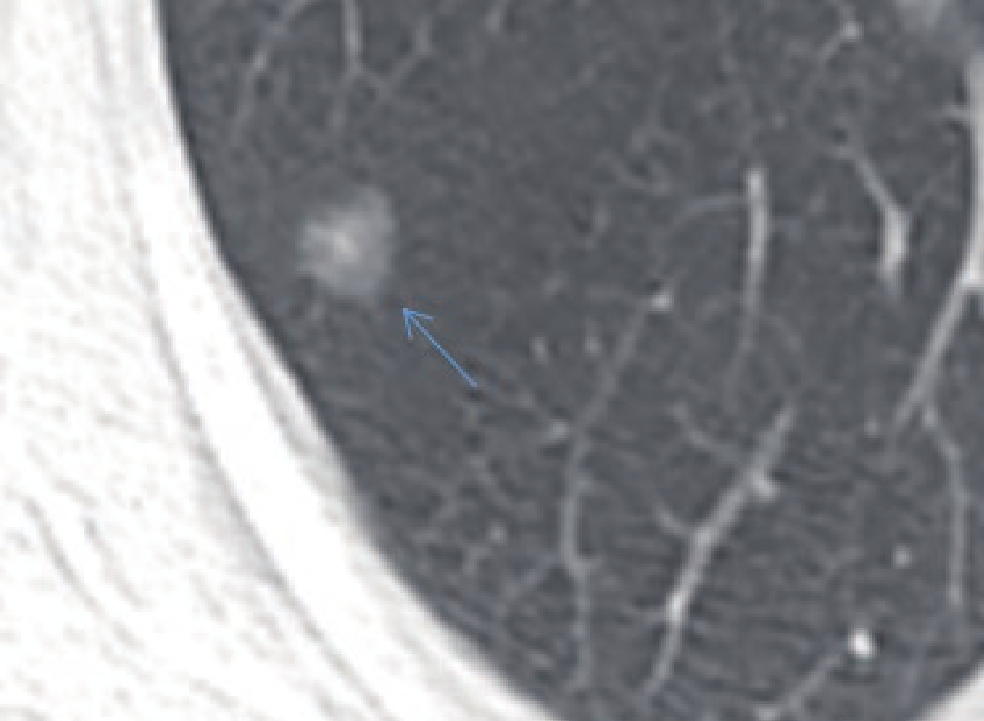
![]() 图 1 女,48岁,CT显示右肺上叶后段SSN(蓝色箭头)。结节平均经约9.6 mm,术后病理诊断为AISFigure 1. A 48-year-old woman with SSN (blue arrow) of the posterior upper lobe of the right lung. The average length of the nodules was approximately 9.6 mm on CT, and the postoperative pathological diagnosis was AIS
图 1 女,48岁,CT显示右肺上叶后段SSN(蓝色箭头)。结节平均经约9.6 mm,术后病理诊断为AISFigure 1. A 48-year-old woman with SSN (blue arrow) of the posterior upper lobe of the right lung. The average length of the nodules was approximately 9.6 mm on CT, and the postoperative pathological diagnosis was AIS1.3 AI参数采集及分析
基于深度学习模型的AI软件由推想预测提供,将图像数据由PACS系统传输至“推想预测”工作站(https://www.infervision.com/),软件自动对SSNs进行分割,记录结节体积及平均径,获取CT值分布直方图,并记录该SSN的以下参数:最大CT值、最小CT值、平均CT值、偏度、峰度、CT百分位数值,其中百分位数值包括第25百分位数(Perc.25%)、第50百分位数(Perc.50%)、第75百分位数(Perc.75%)、第95百分位数(Perc.95%)。
1.4 统计学分析
计数资料以例数(百分比)表示,当T<5且n≥40时采用Fisher确切概率法检验,当T≥5、n≥40时差异性分析采用卡方检验。计量资料首先进行正态性检验,服从正态分布的数据以均值±标准差表示,采用独立样本t检验;不服从正态分布的数据以中位数(四分位间距)表示,采用Mann-Whitney U检验。利用Medcalc软件对有统计意义的变量绘制受试者工作特征曲线(ROC),计算曲线下面积(AUC),并得出最佳临界值。采用Logistic回归分析探究数学建模对腺体前驱病变组及腺癌组的鉴别诊断能力。P<0.05为差异有统计学意义。
2. 结果
2.1 两组临床资料比较
两组中,女性患者多于男性,但性别差异无统计学意义(表1)。女性患者在各类型中所占比例分别为:18/25(72.00%)、51/83(61.45%);男性所占比例为:7/25(28.00%)、32/83(38.55%)。年龄差异在两组间无统计学意义;腺体前驱病变组患者平均年龄(60.93±8.72)岁,腺癌组患者平均年龄(60.78±9.68)岁。结节发生部位在各组之间没有统计学意义,但病灶在各组间均以右肺上叶为好发部位。结节类型在两组之间的差异无统计学意义(表1)。
表 1 腺体前驱病变组与腺癌组临床资料比较Table 1. Comparison of clinical data between the glandular prodromal disease group and adenocarcinoma group临床资料 组别 统计检验 腺体前驱病变组(25例) 腺癌组(83例) t/χ2 P 年龄/岁 60.93±8.72 60.78±9.68 0.088 0.930 性别 男 7 32 0.928 0.335 女 18 51 结节分布 右上 13 34 4.263 0.370 右中 1 5 右下 5 14 左上 3 19 左下 3 11 结节类型 pGGNs 5 13 0.260 0.760 mGGNs 20 70 2.2 两组CT分布直方图纹理参数、结节体积、结节平均径比较
腺体前驱病变组和腺癌组的CT最大值、CT最小值、平均CT值、偏度、Perc.25%、Perc.50%、Perc.75%、结节体积、结节平均径的差异有统计学意义,峰度、Perc.95% 的差异无统计学意义(表2)。
表 2 腺体前驱病变组、腺癌组的CT值分布直方图纹理参数及结节体积、结节平均径比较Table 2. Comparison of the CT value distribution histogram texture parameters, nodule volume and mean nodule diameter between the glandular precursor lesion group and adenocarcinoma group参数 组别 P 腺体前驱病变组(n=25) 腺癌组(n=83) 偏度/HU 0.45(0.25~0.70) 0.215(0.06~0.45) 0.001 峰度/HU -0.64(-1.03~-0.02) -0.95(-1.10~-0.53) 0.260 CT最大值/HU 22.00(-122.00~126.00) 167.00(41.00~338.00) <0.001 CT最小值/HU -757.00(-782.00~-711.00) -653.00(-752.25~-597.00) <0.001 平均CT值/HU -536.67±99.18 -390.16±165.59 <0.001 Perc.25%/HU -605.00(-659.00~-496.00) -416.00(-532.25~-233.50) <0.001 Perc.50%/HU -580.00(-650.00~-522.00) -418.50(-545.00~-296.00) <0.001 Perc.75%/HU -508.00(-673.00~-433.00) -449.00(-610.00~-208.75) 0.003 Perc.95%/HU -329.00(-722.00~-107.00) -528.50(-685.00~-5.25) 0.819 结节体积/mm3 646.86(278.79~1647.36) 1467.00(534.50~3270.94) <0.001 结节平均直径/mm 9.90(8.40~13.50) 15.65(11.12~19.65) <0.001 2.3 诊断效能
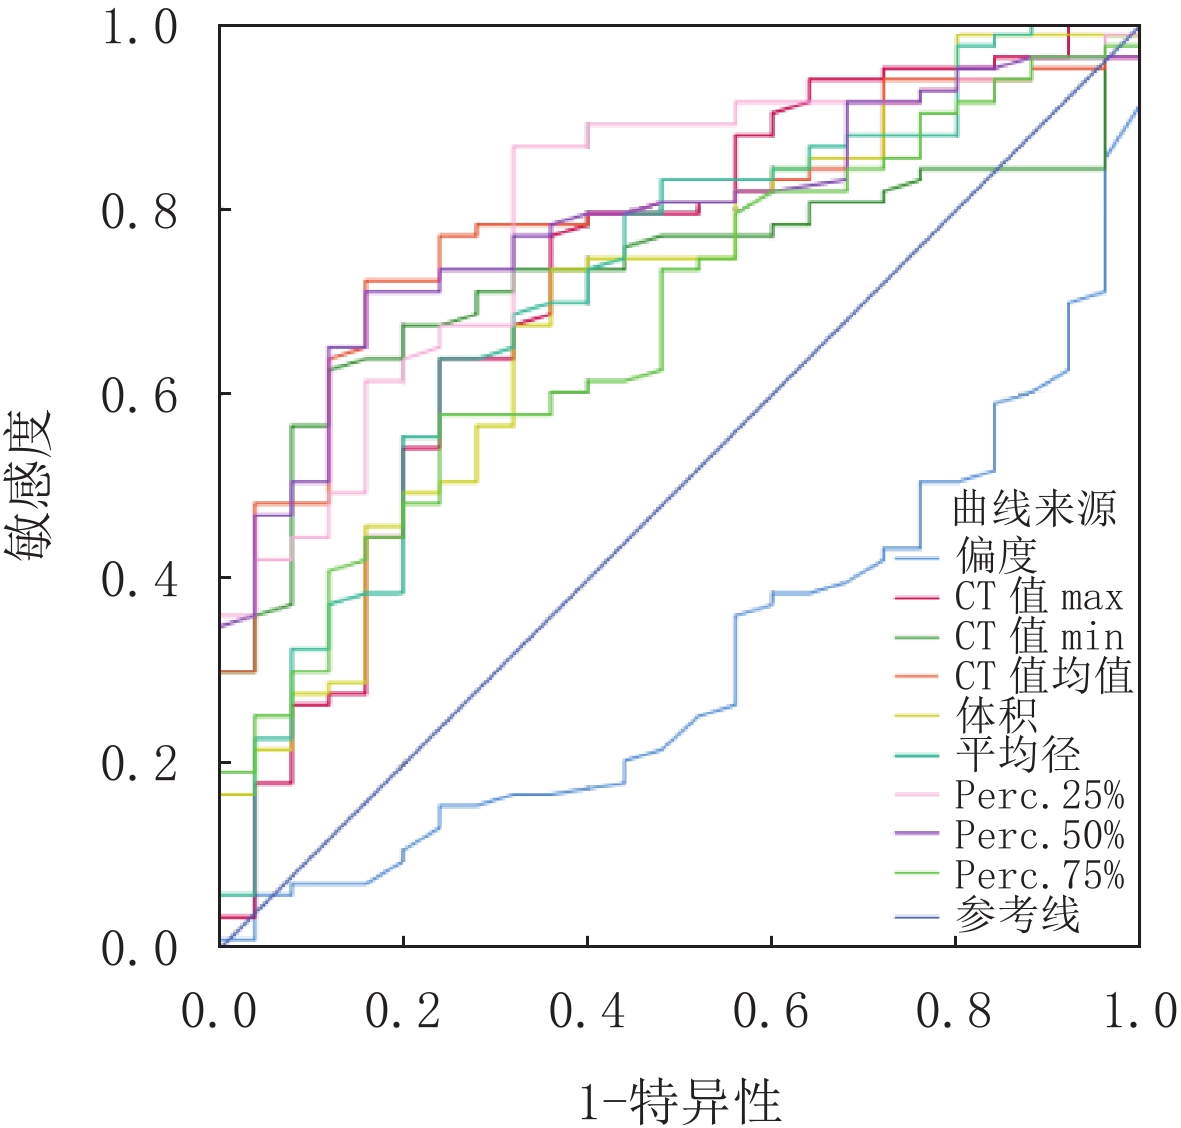
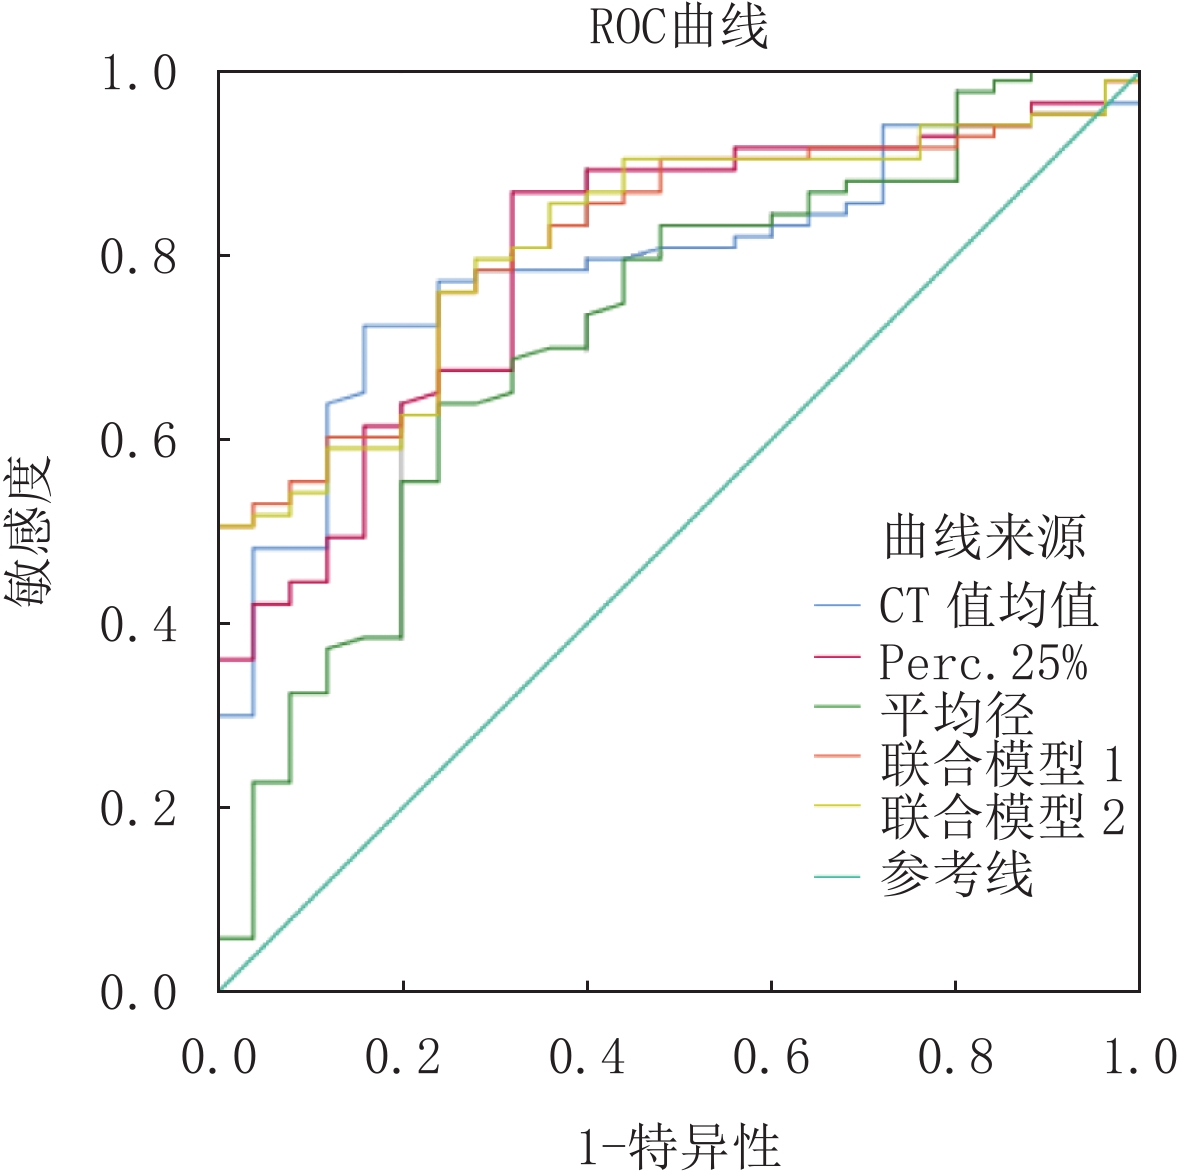
将两组差异有统计学意义的变量行ROC分析。其中,Perc.25% 诊断效能最佳并且敏感度最高,AUC值达0.797,诊断敏感度86.75%,特异性68.00%,诊断临界值 -578 HU;CT值平均值与Perc.50% 曲线下面积相等(AUC值0.787),诊断敏感度72.29%,特异性84.00%,诊断临界值-468 HU,阳性预测值最高(97.90%);将诊断效能最高的Perc.25% 分别于与Perc.50% 和平均CT值两两建立联合诊断模型,判断SSNs的浸润性均有诊断意义(图2和图3),其中Perc.25% 与平均CT值的模型诊断效最高(敏感度75.90%,特异度76.00%,AUC值0.816)且联合诊断模型诊断效能高于Perc.25%与平均CT值单独的诊断效能。
![]() 图 2 腺体前驱病变组与腺癌组的灰度直方图参数ROC图,其中Perc.25% 诊断效能最佳Figure 2. The gray histogram parameters of the adenocar- cinoma group and the glandular precursor lesion group were ROC plots, in which Perc.25% had the best diagnostic efficiency
图 2 腺体前驱病变组与腺癌组的灰度直方图参数ROC图,其中Perc.25% 诊断效能最佳Figure 2. The gray histogram parameters of the adenocar- cinoma group and the glandular precursor lesion group were ROC plots, in which Perc.25% had the best diagnostic efficiency![]() 图 3 腺体前驱病变组与腺癌组的Perc.25%、平均CT值及结节平均直径联合模型的ROC比较Figure 3. Perc.25%, mean CT value and ROC comparison between the glandular precursors and adenocarcinoma groups
图 3 腺体前驱病变组与腺癌组的Perc.25%、平均CT值及结节平均直径联合模型的ROC比较Figure 3. Perc.25%, mean CT value and ROC comparison between the glandular precursors and adenocarcinoma groups由于结节平均径常用于影像科医生判断SSNs浸润性的日常工作中,且两组间结节平均直径的差异具有统计学意义,本研究将诊断效能最高的Perc.25% 与结节平均直径结合得出联合诊断模型2,联合模型2曲线下面积为0.816,相比于结节平均径单独使用提高了诊断效能,并且得到了91.7的阳性预测值(表3)。
表 3 ROC分析结果Table 3. ROC analysis results参数 AUC 最佳临界值 敏感度/% 特异性/% 阳性预测
值/%阴性预测
值/%95% CI 下限 上限 偏度 0.689 0.24 56.63 76.00 88.7 34.5 0.593 0.775 CT最大值/HU 0.725 39.00 77.11 64.00 87.7 45.7 0.631 0.807 CT最小值/HU 0.731 -692.00 62.65 88.00 94.5 41.5 0.737 0.812 平均CT值/HU 0.787 -468.00 72.29 84.00 97.9 47.7 0.697 0.860 Perc.25%/HU 0.797 -578.00 86.75 68.00 90.0 60.7 0.709 0.869 Perc.50%/HU 0.787 -500.00 71.08 84.00 93.7 46.7 0.698 0.860 Perc.75%/HU 0.678 -474.00 57.83 76.00 88.9 35.2 0.581 0.765 体积/mm3 0.701 777.38 73.49 64.00 87.1 42.1 0.606 0.785 平均径/mm 0.718 13.50 63.86 76.00 89.9 38.8 0.623 0.800 联合模型1 0.814 - 75.90 76.00 91.3 48.7 0.728 0.883 联合模型2 0.816 - 75.90 76.00 91.7 48.3 0.730 0.884 3. 讨论
随着AI软件逐渐运用于肺结节的辅助诊断[9-10],影像科医生发现图像纹理分析不仅能探测到肿瘤的微观信息[11],还可提供可量化的参数用于鉴别诊断。CT分布直方图作为一种非侵入性检查手段,将患者影像图像的面积或体积像素进行统计并以更直观的方式表现出来,让影像科医生获得更多有利于诊断的CT定量参数。目前已有部分研究对SSNs的CT值分布直方图进行研究[12-14],结合多个参数值能全面反映SSNs的细微变化,对病变的浸润性起到提示作用。
本研究结果显示,SSNs的CT最大值、CT最小值、平均CT值、偏度、Perc.25%、Perc.50%、Perc.75% 分别与侵袭性有显著的相关性。这些结果表明,CT定量参数,特别是Perc.25% 有助于提高影像科医生对SSNs患者的认识,AUC值达0.797,诊断敏度86.75%,特异性68.00%,Perc.25%≥-578 HU的SSNs表现为腺癌组可能性大。
本研究得出最大CT值优于峰度来区分SSNs的浸润性,与张宏等[15]结果一致。行ROC曲线分析可知,CT最大值的AUC值达0.725,诊断敏感度77.11%,特异度64.00%,当CT最大值≥39 HU的SSNs表现为腺癌组可能性大。本文得出CT最小值对判断SSNs的侵袭性具有诊断价值,经统计学分析得出CT最小值的AUC值达0.731,诊断敏感度达62.65%,特异性为88.00%,当CT最小值≥-692 HU时诊断为腺癌组的可能性最大,与张宏等[15]结果不一致,但与徐小东等[16]结果一致。
我们认为,最小CT值不能客观反映病变内部密度的差异,只能代表SSNs未被肿瘤细胞充满的部分肺组织的密度。Kitami等[17]发现直径<1 cm或平均CT值为 -600 HU的肺纯磨玻璃结节可作为区分未侵袭性病变和侵袭性病变的临界值。本研究得出平均CT值与蔡雅倩[12]结果不同,我们认为AI勾画SSNs时已经避免勾画病灶周围的血管、支气管,但是不可避免的是依旧受患者基础疾病、年龄等因素影响。直方图的偏度是描述变量分布的是否对称的统计量,偏度绝对值越大,分布形态偏移的程度越大。与本文得出的结果相反,本文得出腺体前驱病组的偏度高于腺癌组。导致结果出现偏差的原因是本研究在设计上是回顾性的,且本研究采纳符合去选标准的AAH仅有3例,结果有差异。仅包括接受手术切除的SSNs,而一些每年随访的SSNs由于没有病理诊断而被排除。
Ikeda等[18]指出,CT密度的Perc.75% 有可能区分AAH和肺腺癌,通过ROC曲线分析得知,本研究得出鉴别腺体前驱病变与腺癌的Perc.25%、Perc.50%、Perc.75% 最佳临界值分别为 -578 HU、-500 HU、-474 HU,曲线下面积(AUC)分别为0.797、0.787、0.678,其中Perc.25%、Perc.50% 的AUC值0.7~0.9之间,这说明CT分布直方图的Perc.25%、Perc.50% 对腺体前驱病变组与腺癌组SSNs具有一定的鉴别诊断价值。在9个CT分布直方图参数中,对于腺体前驱病变组和腺癌组的鉴别,以 -578 HU为临界值的Perc.25% 为最佳,其诊断敏感度为86.75%,特异性为68.00%。
随着病变的病理浸润度逐渐增加,从AAH、AIS到MIA再到IAC,SSNs的大小逐渐增大[19]。既往研究[20]证实CT定量参数中特别是结节最长径对预测肺SSNs病变的侵袭性具有重要意义,本研究结果显示,SSNs的最大直径与侵袭性有显著的相关性。通过ROC曲线分析,本研究得出>13.50 mm是预测SSNs浸润性的可靠因子,诊断的敏感度、特异性分别为63.86%、76.00%,AUC为0.718(表3)。步玉兰等[21]的研究表明12.5 mm是侵袭前组和侵袭组的最佳直径临界值,略低于本研究的最佳临界值(13.50 mm),存在这种差异可能的原因是,步玉兰等[20]在分组时将 MIA归为浸润性病变组。在本研究中,MIA与IAC一起被分配到腺癌组,这一结果与Liu等[22]的结果相似。本研究将诊断效能最高的Perc.25% 与结节平均径结合得出联合诊断模型2,联合模型2曲线下面积为0.816,相比于结节平均径提高了诊断效能,并且得到了91.7的阳性预测值。
一般认为随着SSNs体积的增大,病灶内的实性部分趋于出现;体积的增大与SSNs的病理组织学类型是密切相关的,并不同程度上反映了侵袭程度。本研究对于SSNs结果与以往文献报道基本一致,结节的体积与侵袭性有显著的相关性,诊断的敏感度、特异性分别为73.49%、64.00%,AUC为0.701,阳性预测值为87.10%(表3)。本研究建立的Logistic回归模型(灵敏度、特异度和AUC值分别为63%、81% 和0.769)能较好地预测SSNs肺腺癌的CT病理分级,其预测值明显高于单独使用各定量参数。术前预测CT影像特征的病理分型有助于提高术前诊断和鉴别诊断水平,正确的诊断结果可以有效提高患者的存活率。
近年来,伴随着人工智能在医学技术诊断工作中的大量投入,影像医生身上的重担虽然被人工智能分担了一部分,但是责任从未减轻。本研究使用基于深度学习的AI肺结节筛查系统,对SSNs进行三维定量分析,绘制CT值分布直方图,获得体积密度系列定量参数,鉴别肺部腺体前驱病变与腺癌,为能够辅助临床进行精确的诊断以及辅助临床能够为患者提供积极的治疗方法。不足之处是手动勾画存在主观性,用感兴趣区得出CT值分布直方图反映的是二维层面的的密度并不能反映结节三维空间的不均质生长。本研究采用的是AI自动分割结节软件,避免手动分割结节产生的误差。
本研究的局限性。①这是一项源自实际临床实践的回溯性研究,为了证实本研究的结论,有必要进行前瞻性的大样本研究;②仅使用手术病例存在一定的选择性偏差;③样本量相对较小,本研究采用AI软件自动勾画所有结节的轮廓,存在勾画在内的小血管及小气管,可能影响直方图特征。未来希望能够进一步扩大样本量,采取合适的病灶选取办法,完善此项研究。
-
![]()
图 1 女,48岁,CT显示右肺上叶后段SSN(蓝色箭头)。结节平均经约9.6 mm,术后病理诊断为AIS
Figure 1. A 48-year-old woman with SSN (blue arrow) of the posterior upper lobe of the right lung. The average length of the nodules was approximately 9.6 mm on CT, and the postoperative pathological diagnosis was AIS
![]()
图 2 腺体前驱病变组与腺癌组的灰度直方图参数ROC图,其中Perc.25% 诊断效能最佳
Figure 2. The gray histogram parameters of the adenocar- cinoma group and the glandular precursor lesion group were ROC plots, in which Perc.25% had the best diagnostic efficiency
![]()
图 3 腺体前驱病变组与腺癌组的Perc.25%、平均CT值及结节平均直径联合模型的ROC比较
Figure 3. Perc.25%, mean CT value and ROC comparison between the glandular precursors and adenocarcinoma groups
表 1 腺体前驱病变组与腺癌组临床资料比较
Table 1 Comparison of clinical data between the glandular prodromal disease group and adenocarcinoma group
临床资料 组别 统计检验 腺体前驱病变组(25例) 腺癌组(83例) t/χ2 P 年龄/岁 60.93±8.72 60.78±9.68 0.088 0.930 性别 男 7 32 0.928 0.335 女 18 51 结节分布 右上 13 34 4.263 0.370 右中 1 5 右下 5 14 左上 3 19 左下 3 11 结节类型 pGGNs 5 13 0.260 0.760 mGGNs 20 70  下载: 导出CSV
表 2 腺体前驱病变组、腺癌组的CT值分布直方图纹理参数及结节体积、结节平均径比较
Table 2 Comparison of the CT value distribution histogram texture parameters, nodule volume and mean nodule diameter between the glandular precursor lesion group and adenocarcinoma group
参数 组别 P 腺体前驱病变组(n=25) 腺癌组(n=83) 偏度/HU 0.45(0.25~0.70) 0.215(0.06~0.45) 0.001 峰度/HU -0.64(-1.03~-0.02) -0.95(-1.10~-0.53) 0.260 CT最大值/HU 22.00(-122.00~126.00) 167.00(41.00~338.00) <0.001 CT最小值/HU -757.00(-782.00~-711.00) -653.00(-752.25~-597.00) <0.001 平均CT值/HU -536.67±99.18 -390.16±165.59 <0.001 Perc.25%/HU -605.00(-659.00~-496.00) -416.00(-532.25~-233.50) <0.001 Perc.50%/HU -580.00(-650.00~-522.00) -418.50(-545.00~-296.00) <0.001 Perc.75%/HU -508.00(-673.00~-433.00) -449.00(-610.00~-208.75) 0.003 Perc.95%/HU -329.00(-722.00~-107.00) -528.50(-685.00~-5.25) 0.819 结节体积/mm3 646.86(278.79~1647.36) 1467.00(534.50~3270.94) <0.001 结节平均直径/mm 9.90(8.40~13.50) 15.65(11.12~19.65) <0.001
下载: 导出CSV
表 3 ROC分析结果
Table 3 ROC analysis results
参数 AUC 最佳临界值 敏感度/% 特异性/% 阳性预测
值/%阴性预测
值/%95% CI 下限 上限 偏度 0.689 0.24 56.63 76.00 88.7 34.5 0.593 0.775 CT最大值/HU 0.725 39.00 77.11 64.00 87.7 45.7 0.631 0.807 CT最小值/HU 0.731 -692.00 62.65 88.00 94.5 41.5 0.737 0.812 平均CT值/HU 0.787 -468.00 72.29 84.00 97.9 47.7 0.697 0.860 Perc.25%/HU 0.797 -578.00 86.75 68.00 90.0 60.7 0.709 0.869 Perc.50%/HU 0.787 -500.00 71.08 84.00 93.7 46.7 0.698 0.860 Perc.75%/HU 0.678 -474.00 57.83 76.00 88.9 35.2 0.581 0.765 体积/mm3 0.701 777.38 73.49 64.00 87.1 42.1 0.606 0.785 平均径/mm 0.718 13.50 63.86 76.00 89.9 38.8 0.623 0.800 联合模型1 0.814 - 75.90 76.00 91.3 48.7 0.728 0.883 联合模型2 0.816 - 75.90 76.00 91.7 48.3 0.730 0.884
下载: 导出CSV
-
[1] SUNG H, FERLAY J, SIEGEL R L, et al. Global cancer statistics 2020: GLOBOCAN estimates of incidence and mortality worldwide for 36 cancers in 185 countries[J]. CA: A Cancer Journal for Clinicians, 2021, 71(3): 209−249. DOI: 10.3322/caac.21660.
[2] ZHANG Y, FU F, CHEN H, et al. Management of ground-glass opacities in the lung cancer spectrum[J]. The Annals of Thoracic Surgery, 2020, 110(6): 1796−1804. DOI: 10.1016/j.athoracsur.2020.04.094.
[3] QIU T, RU X, YIN K, at al. Two nomograms based on CT features to predict tumor invasiveness of pulmonary adenocarcinoma and growth in pure GGN: A retrospective analysis[J]. Japanese Journal of Radiology, 2020, 38(8): 761−770. DOI: 10.1007/s11604-020-00957-x.
[4] SUN Y, LI C, JIN L, et al. Radiomics for lung adenocarcinoma manifesting as pure ground-glass nodules: Invasive prediction[J]. European Radiology, 2020, 30(7): 3650-3659. DOI: 10.1007/s00330-020-06776-y.
[5] ZHU N, ZHANG D, WANG W, et al. A novel coronavirus from patients with pneumonia in China, 2019[J]. The New England Journal of Medicine, 2020, 382(8): 727−733. DOI: 10.1056/NEJMoa2001017.
[6] LI X, ZHANG W, YU Y, et al. CT features and quantitative analysis of subsolid nodule lung adenocarcinoma for pathological classification prediction[J]. British Medical Council Cancer, 2020, 20(1): 60. DOI: 10.1186/s12885-020-6556-6.
[7] 李艳伶. 病灶直径和CT值联合评估浸润性肺腺癌的诊断价值[J]. 医学信息, 2021, 34(17): 172-174. LI Y L. Diagnosis value of invasive lung adenocarcinoma combined with tumor diameter and CT value[J]. Medical Informatics, 2021, 34(17): 172-174. (in Chinese).
[8] 虞梁, 王俊, 李洪, 等. 肺磨玻璃结节CT影像征象鉴别诊断肺浸润性腺癌与微浸润腺癌[J]. 南京医科大学学报(自然科学版), 2020,40(2): 248−251. YU L, WANG J, LI H, et al. Differential diagnosis of pulmonary infiltrating adenocarcinoma and microinfiltrating adenocarcinoma with CT features of ground glass nodules[J]. Journal of Nanjing Medical University (Natural Science), 2020, 40(2): 248−251. (in Chinese).
[9] 刘娜, 赵正凯, 邹佳瑜, 等. 基于人工智能的胸部CT肺结节检出及良恶性诊断效能评估[J]. CT理论与应用研究, 2021,30(6): 709−715. DOI: 10.15953/j.1004-4140.2021.30.06.06. LIU N, ZHAO Z K, ZOU J Y, et al. Detection of pulmonary nodules and evaluation of benign and malignant diagnosis in chest CT based on artificial intelligence[J]. CT Theory and Applications, 2021, 30(6): 709−715. DOI: 10.15953/j.1004-4140.2021.30.06.06. (in Chinese).
[10] 温德英, 潘雪琳, 姚辉, 等. 探讨CT扫描剂量对人工智能检测肺结节效能的影[J]. CT理论与应用研究, 2021,30(4): 455−465. DOI: 10.15953/j.1004-4140.2021.30.04.06. WEN D Y, PAN X L, YAO H, et al. Effects of CT scanning dose on the performance of artificial intelligence in detecting pulmonary nodules[J]. CT Theory and Applications, 2021, 30(4): 455−465. DOI: 10.15953/j.1004-4140.2021.30.04.06. (in Chinese).
[11] CHEN X, WEI X, ZHANG Z, et al. Differentiation of true-progression from pseudoprogression in glioblastoma treated with radiation therapy and concomitant temozolomide by GLCM texture analysis of conventional MRI[J]. Clinical Imaging, 2015, 39(5): 775-80.
[12] 蔡雅倩, 周小君, 张正华, 等. CT直方图分析鉴别肺良恶性纯磨玻璃结节的价值[J]. 放射学实践, 2020,35(8): 949−952. DOI: 10.13609/j.cnki.1000-0313.2020.08.001. CAI Y Q, ZHOU X J, ZHANG Z H, et al. Value of CT histogram analysis in differentiating lung benign and malignant pure ground glass nodules[J]. Practice Radiology, 2020, 35(8): 949−952. DOI: 10.13609/j.cnki.1000-0313.2020.08.001. (in Chinese).
[13] 毛海霞, 徐蒙莱, 冯银波, 等. CT图像纹理分析对小于10 mm纯磨玻璃结节侵袭性的诊断价值[J]. 中华临床医师杂志(电子版), 2019,13(5): 367−370. MAO H X, XU M L, FENG Y B, et al. Diagnostic value of CT image texture analysis for nodular invasivity in pure ground glass smaller than 10 mm[J]. Chinese Journal of Clinical Physicians (Electronic edition), 2019, 13(5): 367−370. (in Chinese).
[14] YAGI T, YAMAZAKI M, OHASHI R, et al. HRCT texture analysis for pure or part-solid ground-glass nodules: Distinguishability of adenocarcinoma in situ or minimally invasive adenocarcinoma from invasive adenocarcinoma[J]. Japanese Journal of Radiology, 2018, 36(2): 113-121. DOI: 10.1007/s11604-017-0711-2.
[15] 张宏, 丁必彪, 魏恒乐, 等. 高分辨率CT对肺纯磨玻璃结节侵袭性的预测价值[J]. 临床放射学杂志, 2019,38(3): 436−440. DOI: 10.13437/j.cnki.jcr.2019.03.017. ZHANG H, DING B B, WEI H L, et al. High resolution computed tomography (CT) for lung pure glass grinding nodules of invasive predictive value[J]. Journal of Clinical Radiology, 2019, 38(3): 436−440. DOI: 10.13437/j.cnki.jcr.2019.03.017. (in Chinese).
[16] 徐小东, 李君权, 吴向飞, 等. CT密度直方图对肺内纯磨玻璃样结节病理分级的预测价值[J]. 医学影像学杂志, 2021,31(1): 37−39, 42. XU X D, LI J Q, WU X F, et al. The prognostic value of CT density histogram in the pathological grading of pure ground glass nodules in lung[J]. Journal of Medical Imaging, 2021, 31(1): 37−39, 42. (in Chinese).
[17] KITAMI A, SANO F, HAYASHI S, et al. Correlation between histological invasiveness and the computed tomography value in pure ground-glass nodules[J]. Surgery Today, 2016, 46(5): 593−598. DOI: 10.1007/s00595-015-1208-1.
[18] IKEDA K, AWAI K, MORI T, et al. Differential diagnosis of ground-glass opacity nodules: CT number analysis by three-dimensional computerized quantification[J]. Chest, 2007, 132(3): 984−990. DOI: 10.1378/chest.07-0793.
[19] HAMMER M M, PALAZZO L L, KONG C Y, et al. Cancer risk in subsolid nodules in the national lung screening trial[J]. Radiology, 2019, 293(2): 441−448. DOI: 10.1148/radiol.
[20] WANG H, WENG Q, HUI J, et al. Value of TSCT features for differentiating preinvasive and minimally invasive adenocarcinoma from invasive adenocarcinoma presenting as subsolid nodules smaller than 3 cm[J]. Academic Radiology, 2020, 27(3): 395−403. DOI: 10.1016/j.acra.10.1016/j.acra.2019.05.005.
[21] 步玉兰, 李云, 戚元刚, 等. 纯磨玻璃密度结节高分辨率CT征象与病理组织学相关性研究[J]. 临床放射学杂志, 2018,5(2): 247−250. DOI: 10.13437/j.cnki.jcr.2018.02.016. BU Y L, LI Y, QI Y G, et al. Study on the relationship between density nodules and histopathology in high resolution CT of pure ground glass[J]. Journal of Clinical Radiology, 2018, 5(2): 247−250. DOI: 10.13437/j.cnki.jcr.2018.02.016. (in Chinese).
[22] LIU L H, LIU M, WEI R, at al. CT findings of persistent pure ground glass opacity: Can we predict the invasiveness?[J] Asian Pacific Journal of Cancer Prevention, 2015: 16(5): 1925-1928. DOI: 10.7314/apjcp.
-
期刊类型引用(6)
1. 谢玮,夏勇,杨骞,毕臣臣,吕慧,雷朝阳. 基于绕射波的地震属性研究进展. 石化技术. 2024(04): 216-218 .  百度学术
百度学术
2. 梁瑶,霍守东,李学良,舒梦珵,杨晓,石太昆. 利用绕射信息在裂缝型地层中进行钻前风险评估. 地球物理学报. 2023(01): 46-53 . 百度学术
3. 肖广锐,李尧,张羽茹,徐德奎. 绕射波成像在潜山裂缝储层预测中的应用——以渤中A气田为例. 石油物探. 2022(05): 812-820+829 . 百度学术
4. 田涛,李少轩,高阳,韦红. 变质岩潜山裂缝型储层精细预测技术——以渤海海域A油田为例. 石油地质与工程. 2022(06): 8-13 . 百度学术
5. 张志军,肖广锐,李尧. 渤中19-6油田变质岩潜山内幕裂缝地震响应特征及预测技术. 石油地球物理勘探. 2021(04): 845-852+675 . 百度学术
6. 周鹏,肖曦,陶杰,刘方,梁瑶,霍守东,舒梦珵. 绕射信息提取技术及其在致密砂岩断裂系统识别中的应用. 石油物探. 2020(02): 276-282 . 百度学术
其他类型引用(0)
计量
- 文章访问数: 321
- HTML全文浏览量: 161
- PDF下载量: 33
- 被引次数: 6


