
Effect of Computed Tomography Window Technique on the Results of Artificial Intelligence Classification of Lung Lesions
-
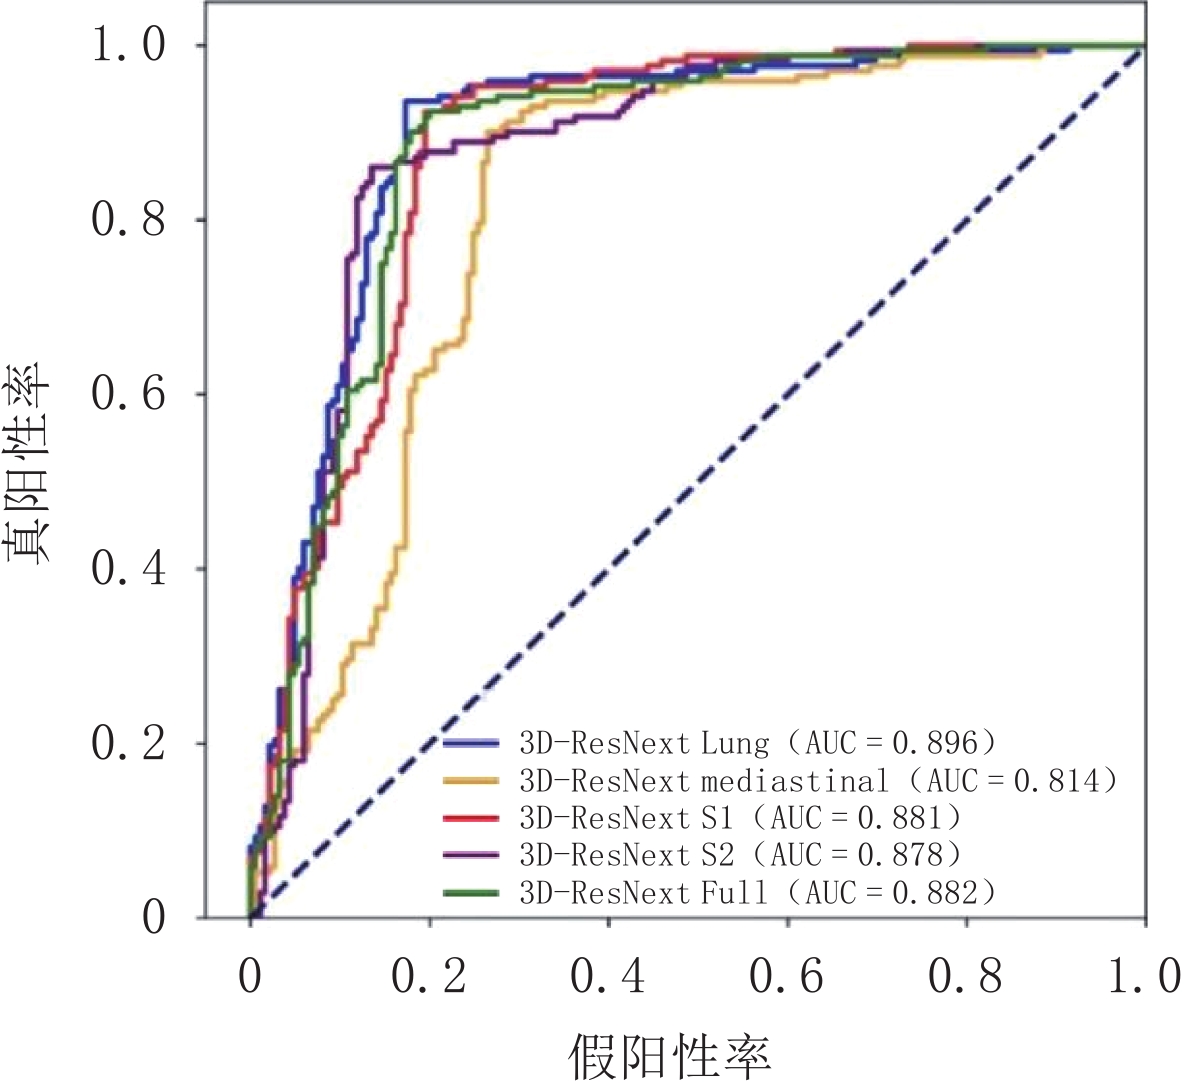
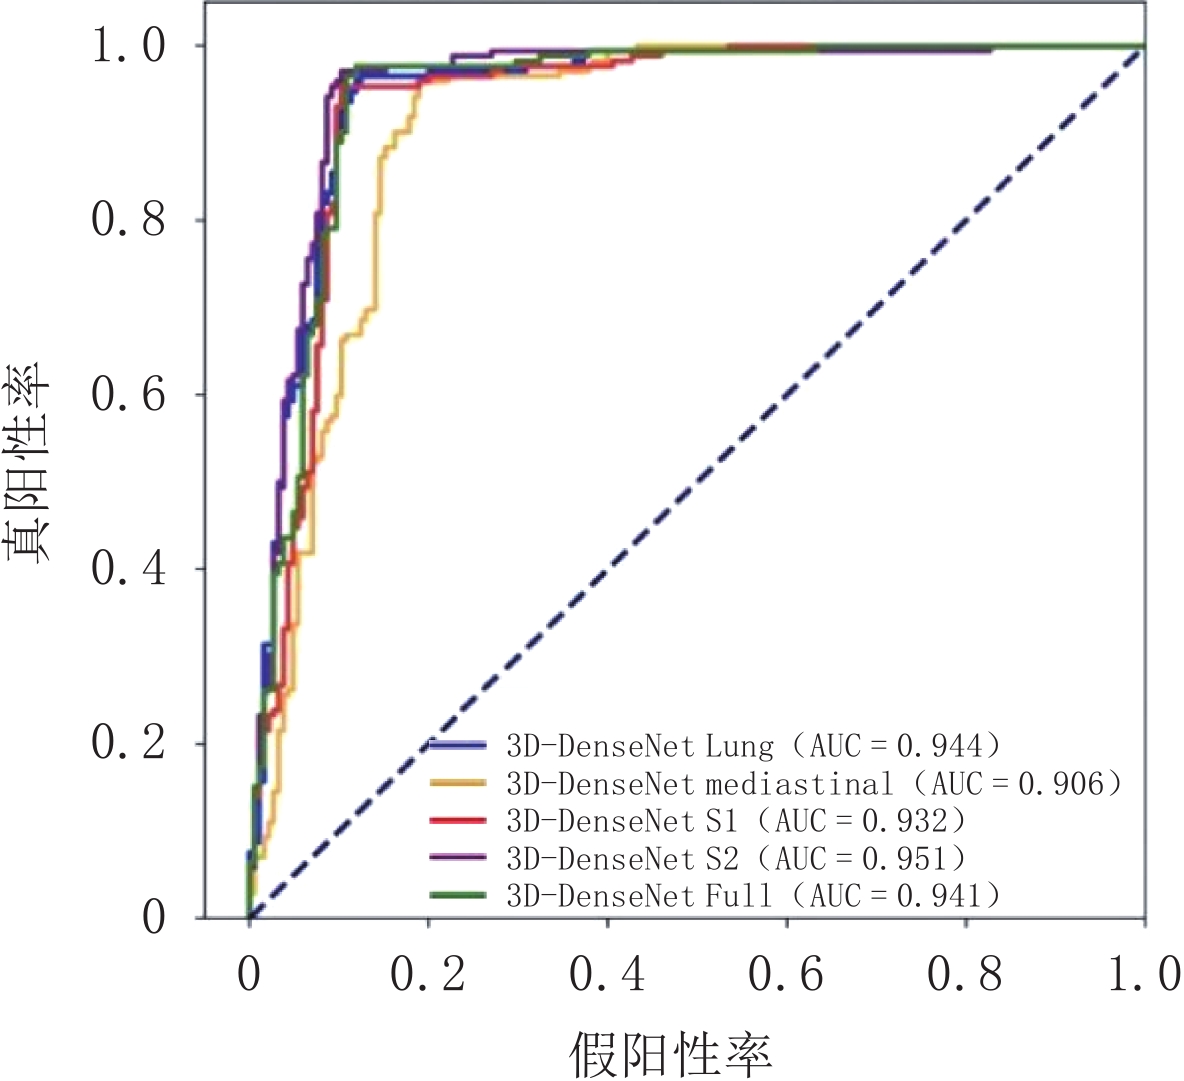
摘要: 目的:应用3种不同的3D CNN的算法及5种CT窗口设置,探讨CT窗技术对人工智能分类肺部病变结果的影响。方法:回顾性分析172例周围型肺癌及185例局灶性肺炎的胸部CT影像资料,选择ResNet、ResNext以及DenseNet 3种不同的3D CNN的算法将病变分为两组,并在每1种3D CNN算法处理过程中应用5种不同的CT窗口设置,包括肺窗(1500,-600),纵隔窗(350,40),自定义窗口1(SW1)(1000,40),自定义窗口2(SW2)(1000,-100),全窗(4096,1024),分别计算分类准确率及AUC结果,并进行ROC曲线的两两对比。结果:ResNet的平均分类准确率最低为纵隔窗85.732%,AUC值为0.871;平均分类准确率最高为全窗,达91.596%,AUC值为0.946。ResNext的平均分类准确率最低为纵隔窗81.528%,AUC值为0.814;平均分类准确率最高为全窗,达86.568%,AUC值为0.882。DenseNet的平均分类准确率最低为纵隔窗87.954%,AUC值为0.906;平均分类准确率最高为SW2,达93.274%,AUC值为0.951。应用medcalc将3种3D CNN的5种窗口下的ROC曲线进行了两两对比发现,纵隔窗与肺窗、纵隔窗与SW1、纵隔窗与SW2之间的AUC值比较均有统计学意义。结论:3种3D CNN的分类诊断效能差别不大;CT窗口设置对CNN分类肺部病变结果有影响,在纵隔窗设置下以上3种人工智能算法对该两类肺部病变的诊断效能最差。Abstract: Objective: To use three different 3D CNN algorithms and five different computed tomography (CT) window settings to study the effect on the results of artificial intelligence classification of lung lesions in different CT window techniques. Method: A total of 172 cases of peripheral lung cancer and 185 of focal pneumonia who underwent chest CT were analyzed. Three different 3D CNN algorithms were selected (ResNet, ResNext, and DenseNet) to divide the lesions into two groups. Five different CT window settings, including lung window (1500, 600), mediastinal window (350, 40), custom window 1 (SW1) (1000, 40), and custom window 2 (SW2) (1000, 100), were used retrospectively. We calculated classification accuracy, receiver operating characteristic (ROC) curve, and area under the curve (AUC). The ROC curve was compared in pairs. Results: The average classification accuracy of ResNet was the lowest in the mediastinal window (85.732%; AUC value: 0.871) and the highest in the full window (91.596%; AUC value: 0.946). The average classification accuracy of ResNext was the lowest in the mediastinal window (81.528%; AUC value: 0.814) and the highest in the full window (86.568%; AUC value: 0.882). The average classification accuracy of DenseNet was the lowest in the mediastinal window (87.954%; AUC value: 0.906) and the highest in the SW2 window (93.274%; AUC value: 0.951). Medcalc was used to compare ROC curves under five windows of three 3D CNN. The AUC values between mediastinal window and lung window, mediastinal window and SW1, and mediastinal window and SW2 were statistically significant. Conclusion: There is little difference in the diagnostic efficacy of the three 3D CNN. Different CT window settings have an influence on the results of CNN classification of the lung lesions, and the diagnostic efficiency of the three 3D CNN is the worst under the mediastinal window.
-
Keywords:
- artificial intelligence /
- CT window technique /
- 3D CNN /
- lung lesions
-
电阻率层析成像(electrical resistivity tomography,ERT)是一种近年来广泛用于浅地表勘探的地球物理方法。由于电阻率与水介质存在的密切联系,电阻率层析成像技术被越来越多地用于帮助水文工程师、考古学家和地质学家探测地下介质[1]。Pidlisecky等[2]使用阻率层析成像技术获得了蒙特利湾海岸长6.8 km、深150 m的电阻率图像,用以分析该地区的海水入侵情况;Abbas等[3]将探地雷达和电阻率层析成像技术应用于整合规划中,确定了黄金木乃伊谷(the Valley of the Golden Mummies)的考古潜力,并绘制出了可靠的墓葬图;Kolawole等[4]分别反演获得了沿着和跨越地表破裂带的电阻率剖面,以成像马拉维卡龙加(Karonga,Malawi)6.0级地震破坏带的近地表结构。
为了增强电阻率层析成像的分辨率和适用性,一部分学者研究提高反演精度和计算效率的理论与方法,另一部分学者着眼于不同电极组合的优缺性研究以及直流电阻率数据联合反演问题。大多数直流电阻率测量是用传统的观测阵列(如温纳、斯伦贝谢、单极-单极、偶极-偶极和单极-偶极观测阵列)进行的,这些观测阵列在分辨率、探测深度和噪声灵敏度等方面各有优势。一般来说,温纳和温纳-斯伦贝谢观测阵列对噪声的敏感度较低并具有较高的垂直分辨率,而偶极-偶极和单极-偶极观测阵列具有较低的信噪比和较高的横向分辨率[5-6]。然而,在许多调查领域和案例中,要求ERT在各个探测方向都具有良好的分辨率,这给实际工作带来了挑战。
2004年Stummer等[7]提出了一种实验设计程序,使用基于灵敏度的优化方案来确定可以提供最大地下信息的非常规电极配置组合,并发现来自不同电极阵列的组合数据集比单个数据集携带更多的信息。因此,从理论上讲,将不同电极观测阵列采集的同一地点的数据集进行联合反演,可以综合各观测阵列的相对优势,从而得到较好的结果。
2003年Vega等[8]首先提出对从烃污染现场获得的偶极-偶极和温纳观测阵列数据集进行联合反演,其结果表明,与单一观测阵列反演结果相比,联合反演结果具有较好的探测深度和较好的横向分辨率;2007年Athanasiou等[9]在二维联合反演算法中引入了加权因子,以避免特定观测阵列数据在迭代反演过程中占据绝对优势,从而允许来自各个观测阵列的数据平等地参与反演,并且发现了联合反演方法的有效性取决于地球物理数据集的互补性;2010年Loke等[10]采用 4种方法自动确定最优观测阵列,经理论模型和野外实测数据检验,最优阵列的电阻率成像能够提供最大的模型分辨率;2015年Ishola等[11]采用k-均值算法对 3种不同电极观测阵列的二维电阻率反演模型进行组合和分类,利用该方法的相关性,更好地识别出与所调查区域的岩性单元对应的聚类簇;谭茂金等[12]以双感应和双侧向测井数据为例,认为将模型参数和数据归一化处理后联合反演的精度和分辨率比任何单一测井装置都要高;江沸菠等[13]通过极限学习机在高对比度模型下对低对比度异常体的分辨能力进行分析,发现基于多电极装置的超高密度电法反演往往能够取得比单一装置(温纳、偶极-偶极观测阵列)更好的反演结果。
本文主要研究温纳、偶极-偶极电极阵列组合的联合三维电阻率层析成像反演问题,并且在绍兴平水镇五星上塘小馒头墩古墓葬探测案例中,将不同电极阵列单独反演结果与联合反演结果进行多方面比较,验证联合反演的有效性。
1. 方法理论
Pidlisecky等[14]根据前人研究,采用基于二阶有限体离散的预处理双共轭梯度算法求解控制偏微分方程正演解,并利用牛顿共轭梯度算法求解模型修改量以进行反演,最后使用零阶和一阶吉洪诺夫(Tikhonov)正则化约束反演问题。
1.1 电阻率层析成像正演
电阻率层析成像实验会产生一系列响应已知输入电流的电压测量值,其中,电势场
${\boldsymbol{u}}$ 、输入电流I与地下电导率结构$ \sigma $ 通过以下偏微分方程关联:$$ \nabla \cdot \left( { - \sigma \nabla {\boldsymbol{u}}} \right) = I\Big( {\delta \left( {r - {r_{{{\text{s}}^ + }}}} \right) - \delta \left( {r - {r_{{{\text{s}}^ - }}}} \right)} \Big) \text{,} $$ (1) 式中,
$ r - {r_{{{\text{s}}^ + }}} $ 和$ r - {r_{{{\text{s}}^ - }}} $ 分别是正负极电源位置,并且$ \delta \left( {r - {r_{\text{s}}}} \right) $ 是以电源位置为中心的狄拉克函数。需要注意的是,本文使用电导率$ \sigma $ 来描述各种物理关系,但在涉及测量的描述中使用电阻率$ {\rho _{}}(\rho = 1/\sigma ) $ 。用矩阵表示,即:$$ \Big( {{\boldsymbol{DS}}(\sigma ){\boldsymbol{G}}} \Big){\boldsymbol{u}} = {\boldsymbol{A}}(\sigma ){\boldsymbol{u}} = {\boldsymbol{q}} \text{,} $$ (2) 式中,
${\boldsymbol{D}}$ 和${\boldsymbol{G}}$ 分别表示三维散度和梯度算子;${\boldsymbol{S}}(\sigma )$ 为包含电导率值的主对角矩阵;${\boldsymbol{A}}(\sigma )$ 为完整的正演算子矩阵;${\boldsymbol{q}}$ 是包含正负电流源位置的矢量。由式(2)可知,对于给定的电导率模型,可求解下式:$$ {\boldsymbol{u}} = {{\boldsymbol{A}}^{ - 1}}(\sigma ){\boldsymbol{q}} \text{,} $$ (3) 以产生每一处的势场
${\boldsymbol{u}}。$ 并且,我们需要定义投影矩阵${\boldsymbol{Q}}$ 将势场${\boldsymbol{u}}$ 投影到观测点上。因此,从电导率模型正演计算所得的理论观测数据${\boldsymbol{d}}$ 可表示为:$$ {\boldsymbol{d}} = {\boldsymbol{Qu}} = {\boldsymbol{Q}}{{\boldsymbol{A}}^{ - 1}}(\sigma ){\boldsymbol{q}} 。 $$ (4) 1.2 多电极阵列联合反演
由式(4)可知,如果想从观测数据(测量电压值和输入电流)中获得地下电导率结构,就必须解决非线性优化问题。此外,由于已知数据远小于要求解的模型参数数量,所以反演问题是欠定的。单独反演的目标函数可写为:
$$ \phi ({\boldsymbol{m}}) = \frac{1}{2}{\Big\| {{\boldsymbol{WdW}}\Big( {{\boldsymbol{d}}({\boldsymbol{m}}) - {{\boldsymbol{d}}_{{\rm{obs}}}}} \Big)} \Big\|^2} + \frac{\beta }{2}{\Big\| {{\boldsymbol{W}}\left( {{\boldsymbol{m}} - {{\boldsymbol{m}}_{{\rm{ref}}}}} \right)} \Big\|^2} \text{,} $$ (5) 式中,
${{\boldsymbol{d}}_{{\rm{obs}}}}$ 为观测数据向量;${\boldsymbol{d}}({\boldsymbol{m}})$ 为给定电导率模型正演得到的理论观测数据向量。除了目标函数的第1项(数据拟合项)外,第2项吉洪诺夫项包含了关于模型的先验信息;$ \beta $ 是正则化参数,在最小化目标函数过程中用以平衡数据误差和模型正则化的影响;${\boldsymbol{m}}$ 是某次迭代的模型,参数设置为$\ln \left( \sigma \right)$ (防止过大测量值对反演结果有压倒性影响并对解施加正约束);${{{\boldsymbol{m}}}_{{\rm{ref}}}}$ 是参考模型。${{\boldsymbol{WdW}}}$ 和${{\boldsymbol{W}}}$ 分别为数据权重项和模型正则化矩阵,用以平衡数据量级对反演的影响和平滑生成模型。特别地,在反演过程中,我们需要谨慎选取合适的参数以控制误差。模型正则化矩阵
$ {\boldsymbol{W}} $ 是单位矩阵和离散梯度算子的组合。对梯度分量应用不同的权重会导致对应方向上不同程度的平坦度。例如,较大的X梯度分量权重会促使该方向上的反演结果十分平坦。本文在模型3方向上都设置平坦度参数为1。此外,目前有3种最常见选取正则化参数$ \beta $ 的方法:整个反演过程都采用一个固定值;每次迭代后$ \beta $ 都减少一定值;使用L-curve判别标准确定每次迭代的最优值[14]。一般来说,第3种方法可以取得最好的反演效果,但需要持续不断地确定最优值、耗费大量计算机资源。本文采取韩波等[15]的反演策略,即观测数据在有噪音的情况下正则化参数为10−4,无噪音的情况下为10−6。给定目标函数后,我们采用高斯-牛顿法反演出匹配观测数据的最佳模型,即模型一阶导,得到高斯-牛顿更新:$$ \begin{array}{*{20}{c}} {\left( {{{{\boldsymbol{J}}}^{{\rm{T}}}}{{\boldsymbol{J}}} + \beta {{{\boldsymbol{W}}}^{{\rm{T}}}}{{\boldsymbol{W}}}} \right) \cdot \delta {{\boldsymbol{m}}} = - \bigg( {{{{\boldsymbol{J}}}^{{\rm{T}}}}\Big( {{{\boldsymbol{d}}}({{\boldsymbol{m}}}) - {{\boldsymbol{d}}_{{\rm{obs}}}}} \Big) + \beta {{{\boldsymbol{W}}}^{{\rm{T}}}}{{\boldsymbol{W}}}\left( {{{\boldsymbol{m}}} - {{{\boldsymbol{m}}}_{{\rm{ref}}}}} \right)} \bigg)} \\ {{{\boldsymbol{H}}} \cdot \delta {{\boldsymbol{m}}} = - {{\boldsymbol{g}}}} \end{array} \text{,} $$ (6) 其中,
${\boldsymbol{J}}$ 是雅可比(Jacobian)矩阵,即${{\partial {{\boldsymbol{d}}}}/ {\partial {{\boldsymbol{m}}}}}$ ;${\boldsymbol{g}}$ 是目标函数梯度,${\boldsymbol{H}}$ 则是近似海森(Hessian)矩阵。在反演迭代时,我们避免显式使用这两个稠密矩阵求解模型更新矩阵$\delta {{\boldsymbol{m}}}$ ,相反通过一系列矩阵向量乘积避免直接构造雅可比矩阵(${{\boldsymbol{J}}}$ 算法)、采用预处理共轭梯度算子解线性系统$\delta {{\boldsymbol{m}}} = - {{{\boldsymbol{H}}}^{ - 1}} \cdot {{\boldsymbol{g}}} \;(\;\delta {{\boldsymbol{m}}}算法\;)\;$ [14]。一旦我们得到模型更新矩阵,我们使用线性搜索来更新模型:
$$ {{{\boldsymbol{m}}}_{i + 1}} = {{{\boldsymbol{m}}}_i} + \alpha \delta {{\boldsymbol{m}}} \text{,} $$ (7) 式中,
${{{\boldsymbol{m}}}_{i + 1}}$ 代表着新生成的模型,$ \alpha $ 是用来控制模型更新大小的参数,可以用Armijo步长[16]来搜索确定。目前,不同电极阵列数据反演方法普遍采用的是直接联合反演,即将数据集拼接在一起,直接输入单独反演程序,以数据驱动为主要特征。然而,大量二维电阻率层析成像研究表明反演过程中一些观测阵列的数据相对另外一些观测阵列的数据占据主导地位[9],例如,来自偶极-偶极的测量值较温纳往往有两倍更强的灵敏度。为了克服这一特性,需要在反演过程中额外添加加权因子以平衡各观测阵列对反演的贡献。因为雅可比(灵敏度)矩阵将模型参数变量与观测数据变化联系起来,所以可以利用各个观测阵列数据集产生的雅可比矩阵来确定加权因子。
如果M是来自所有不同观测阵列观测数据的总个数,加权因子可以通过一个M×M大小的主对角矩阵
${{\boldsymbol{W}}_B}$ 引入,其主对角元素如下式确定:$$ {{{{W}}}}_{{B}_{ii}}=\left\{\begin{aligned} &{b}_{i}=1,\;如果{\text{i}}对应着参考阵列\;{{A}}\;的测量值\\ &{b}_{i}={b}^{B,C,\cdots ,}\text{,}\;如果对应着其他阵列\;{{{B}},\;{{C}},}\;{\cdots}\; {的值}\end{aligned} \text{,} \right.$$ (8) 式中,i=1, 2
$,\cdots, $ M。对于每个排列,$ {b_i} $ 都可以取(0,∞)之间的值,即$ {b_i} $ 值越大,排列B, C,$\cdots$ 在反演中的贡献越大。特别说明,当$ {b_i} $ 为1时,没有额外的加权被应用,即直接联合反演;当$ {b_i} $ 取0时,等于将特定数组的测量值从反演中排除;当$ {b_i} $ 取较大的值,等价于最小化参考排列A对反演的影响。为了寻找使得反演中所有测量值都能同等比例贡献的权重因子b的最优值,需要利用参考排列 A和其他阵列 B的矩阵雅可比矩阵
${{\boldsymbol{J}}^A}$ 和${{\boldsymbol{J}}^B}$ :$$ \begin{array}{*{20}{c}} {{{\boldsymbol{J}}^A} = \left( {\begin{array}{*{20}{c}} {J_{11}^A}& \cdots &{J_{1M}^A} \\ \vdots & \ddots & \vdots \\ {J_{N1}^A}& \cdots &{J_{NM}^A} \end{array}} \right)}&{\;{{\boldsymbol{J}}^B} = \left( {\begin{array}{*{20}{c}} {J_{11}^B}& \cdots &{J_{1M}^B} \\ \vdots & \ddots & \vdots \\ {J_{N1}^B}& \cdots &{J_{NM}^B} \end{array}} \right)} \end{array} \text{,} $$ (9) 并由下式得到权重因子b:
$$ {{{\boldsymbol{J}}}_j^A = \displaystyle\frac{{\sqrt {\displaystyle\sum\limits_{i = 1}^{{N_A}} {{{\left| {{{\boldsymbol{J}}}_{ij}^A} \right|}^2}} } }}{{{N_A}}}}\;\quad{{{\boldsymbol{J}}}_j^B = \frac{{\sqrt {\displaystyle\sum\limits_{i = 1}^{{N_B}} {{{\left| {{{\boldsymbol{J}}}_{ij}^B} \right|}^2}} } }}{{{N_B}}}}\;\quad{b = \sum\limits_{j = 1}^M {\frac{{{{\boldsymbol{J}}}_j^A}}{{{{\boldsymbol{J}}}_j^B}}} } \text{,} $$ (10) 在本文中,由于偶极-偶极观测阵列相较于温纳观测阵列具有更强的灵敏度,我们将偶极-偶极观测阵列设为参考阵列。加入相应的阵列权重后,目标函数变为:
$$ \phi ({{\boldsymbol{m}}}) = \frac{1}{2}{\Big\| {{{{\boldsymbol{W}}}_B}{{\boldsymbol{WdW}}}\Big( {{{\boldsymbol{d}}}({{\boldsymbol{m}}}) - {{{\boldsymbol{d}}}_{{\rm{obs}}}}} \Big)} \Big\|^2} + \frac{\beta }{2}{\Big\| {{\boldsymbol{{W}}}\left( {{{{\boldsymbol{m}}}_i} - {{{\boldsymbol{m}}}_{{\rm{ref}}}}} \right)} \Big\|^2} 。 $$ (11) 2. 理论模型分析
本文分别建立如图1所示的嵌套模型和差异模型,模拟生成偶极-偶极和温纳观测阵列的合成数据集,以测试不同电极阵列直流电阻率数据联合反演相较于单一阵列反演结果的有效性。其中,由于偶极-偶极装置信号强度较弱,最好设置小于6的隔离系数,即n<6[17],考虑到合成数据量以及理论模型深度,最大隔离系数设置为4。对于温纳观测阵列和偶极-偶极观测阵列,测量数据的标准偏差一般小于2% 和4%[6]。综合考虑不同电极阵列数据拟合的收敛行为后,设置温纳观测阵列、偶极-偶极观测阵列、联合反演观测数据标准偏差分别为1%、3% 和1%,该水平的数据偏差足以模拟实际情况且不会对反演结果造成明显的偏差。同时,Loke等[18]认为应该将模型顶层的厚度设置为相邻电极间距的0.5倍,并且由于电阻率测量方法的分辨率随深度的增加而降低,每一层的厚度增加15%。本文通过前期大量三维模型实验,证明将顶层厚度设置为相邻电极间距的0.4倍可以得到更好的浅层分辨率,同时避免可能发生的电极效应。
2.1 嵌套模型
嵌套模型用于测试联合反演算法的分辨能力,并被广泛用于多个研究[7,13-14]。在本实验中,在模型表面布置了100个电极,电极间距1.778 m(图1(a)),偶极-偶极和温纳观测阵列分别收集了1250和372个数据,同时将整个模型空间划分了19040个单元格。该嵌套结构包括一个内部长方体的低阻异常体,其电阻率为10 Ω·m,在其外部,通过将电阻率设置为40 Ω·m来模拟复杂矿体或者溶液扩散边缘,背景电阻率设置为200 Ω·m(图1(b))。
不同电极阵列直流电阻率数据集单独反演、直接联合反演和加权联合反演结果如图2所示,从上到下依次为理论模型、温纳单独反演结果、偶极-偶极单独反演结果、直接联合反演结果、加权联合反演结果;从左到右依次为立体图、沿X方向纵切图、深度为4 m的横切图。温纳(图2(a))和偶极-偶极(图2(b))反演结果显示,温纳阵列纵向分辨率优于偶极-偶极,但横向分辨率远不及偶极-偶极装置。直接联合反演的结果(图2(d))与偶极-偶极装置单独反演结果基本接近,只是其电阻率幅值进一步受到抑制。而加权联合反演横向分辨率优于温纳装置单独反演,但比偶极-偶极装置差;纵向分辨率则优于偶极-偶极装置,次于温纳装置。该案例证明加权联合反演的反演模型结合了两个装置分辨率的优点,一定程度上弥补了两种不同电极装置的固有缺陷。但不论哪种方法都不足以清晰地分辨嵌套结构,造成这种现象的原因可能是经典吉洪诺夫正则化对于连续型电导率重构更有效[15]。
![]() 图 2 嵌套模型及其反演结果从上至下分别为理论模型、温纳单独反演、偶极-偶极单独反演、直接联合反演、加权联合反演结果;从左至右依次为立体图、纵切图、深度4 m处横切图。Figure 2. Diagrams of the nested model and its inversion results
图 2 嵌套模型及其反演结果从上至下分别为理论模型、温纳单独反演、偶极-偶极单独反演、直接联合反演、加权联合反演结果;从左至右依次为立体图、纵切图、深度4 m处横切图。Figure 2. Diagrams of the nested model and its inversion results为了说明各方法的精度,分析总结各方法在反演过程中的关键参数(表1)。在收敛标准为最大模型更新量低于10-2时,温纳迭代13次即满足收敛条件,而偶极-偶极和直接联合反演需要18次、加权联合反演需要17次。目标函数残差是每次迭代的目标函数较初始迭代的百分比,数据拟合和惩罚函数分别对应目标函数数据拟合项、正则化项的数值。数据拟合和惩罚函数两个重要参数显示,无论是直接联合反演还是加权联合反演效果均优于单一装置(温纳、偶极-偶极)的反演结果,并且加权联合反演效果更好,说明联合反演得到的模型更加符合理论要求。而均方根误差显示直接联合反演最终结果更符合观测数据的要求,偶极-偶极次之,最后则是加权联合反演和温纳,这说明加权联合反演在同一均方根误差水平上远优于单独反演。
表 1 不同反演方法恢复嵌套模型的分析参数Table 1. The analysis parameters of different inversion methods recovering nested model类型 迭代次数 残差/% 均方根误差 数据拟合 惩罚函数 温纳 13 36.56 2.137-2 5.961-2 2.945-2 偶极-偶极 18 21.03 2.560-2 3.197-1 3.129-1 直接联合反演 18 20.79 1.742-2 2.277-1 1.825-1 加权联合反演 17 29.98 2.709-2 1.772-1 1.155-1 2.2 差异模型
此外,我们还设计了一个差异模型,即将异常体分布在不同深度以测试联合反演算法对处于不同深度的高低阻异常体的分辨情况[18-19]。观测系统与嵌套模型实验一致,上部长方体为电阻率3000 Ω·m的异常体,深度为2~5 m,底部基座电阻率设置为1000 Ω·m,深度在 8 m以下,背景电阻率设置为500 Ω·m(图1(c))。使用上述算法反演模拟得到的偶极-偶极和温纳数据集,其结果如图3所示,从上到下依次为理论模型、温纳单独反演结果、偶极-偶极单独反演结果、直接联合反演结果、加权联合反演结果;从左到右依次为立体图、沿X方向纵切图、深度为4 m的横切图。
![]() 图 3 差异模型及其反演结果从上至下分别为理论模型、温纳单独反演、偶极-偶极单独反演、直接联合反演、加权联合反演结果;从左至右依次为立体图、纵切图、深度4 m处横切图。Figure 3. Diagrams of the discrepancy model and its inversion results
图 3 差异模型及其反演结果从上至下分别为理论模型、温纳单独反演、偶极-偶极单独反演、直接联合反演、加权联合反演结果;从左至右依次为立体图、纵切图、深度4 m处横切图。Figure 3. Diagrams of the discrepancy model and its inversion results差异理论模型中,这4种方法的特点更加明显。温纳观测阵列纵向分辨率极高,基本体现出了上部异常体的大致长度,但在横向上成像出一种阶梯状形态,分辨率远远低于偶极-偶极观测阵列,然而偶极-偶极单独反演恢复的纵向深度和形状更接近于理论模型,但未能显示基座异常,说明偶极-偶极阵列探测深度的限制。直接联合反演和加权联合反演结合了温纳和偶极-偶极观测阵列的特点,纵向和横向分辨率都得到了优化——纵向上深度和长度更接近理论模型,且横向上形状阶梯状伪影得到了极大地改善,更接近于长方形。同时,温纳、直接、加权联合反演似乎都体现了底部基座的特性,但不明显。同嵌套模型理论实验一样,需要从参数上进一步讨论直接和加权联合反演的结果。
在模型更新量低于1.6×10⁻²时,温纳迭代9次即满足条件,偶极-偶极需要6次,直接联合反演需要7次、加权联合反演则需要9次。总之,无论是直接联合反演还是加权联合反演效果均优于单一装置(温纳、偶极-偶极),但偶极单独反演在高阻异常体恢复方面远优于其他方法。均方根误差分析显示偶极-偶极结果对观测数据的偏差不大,直接联合反演次之,最后是加权联合反演和温纳,同样也说明了加权联合反演在同一均方根误差水平上远优于单独反演(表2)。
表 2 不同反演方法恢复差异模型的分析参数Table 2. The analysis parameters of different inversion methods recovering the discrepancy model类型 迭代次数 残差/% 均方根误差 数据拟合 惩罚函数 温纳 9 22.53 1.441-2 1.476-2 1.415-2 偶极-偶极 6 32.26 9.270-3 8.206-2 4.396-2 直接联合反演 7 14.99 1.019-2 1.422-1 8.540-2 加权联合反演 9 19.29 1.257-2 1.167-1 5.748-2 2.3 实验分析
通过以上两个理论模型,本文发现无论是直接联合反演还是加权联合反演结合了温纳和偶极-偶极观测阵列的优点——联合反演结果纵向分辨高于偶极-偶极观测阵列且横向分辨率高于温纳装置。可以说,联合反演较于单一观测阵列反演的优势明显且算法有效。从某种程度上来说,温纳和偶极-偶极观测阵列的基于雅可比矩阵的加权联合反演综合了两者的优点,能够提供一个更加可信的结果。
另一方面,在本文中,直接联合反演和加权联合反演的反演结果并不如Athanasiou等[9]的研究明显,原因可能在于联合反演算法框架不同且三维电阻率层析成像反演较于二维反演受到模型参数的影响更大。
3. 野外数据应用
野外数据来自绍兴平水镇五星上塘小馒头墩的越国贵族墓,属于全国重点文物保护单位。尽管出于文物保护的目的无法进行全面细致的考古勘探,但是地球物理方法,特别是电阻率层析成像,可以帮助我们更好地了解地下情况。该墓葬封土堆保存较为完好,呈现覆斗状,大致南北走向,地势南偏高北偏低。底部边长约65 m,宽约32 m;封土堆顶部边长约45 m,宽约20 m;底面和顶面的高差大约5~6 m(图4(a))。由于墓葬封土地形起伏较大陡峭、存在盗洞且上覆茂密竹林,常规三维电阻率观测难以实施。墓葬的靠北侧地形起伏较大、靠南侧的外围地表部分相对平坦,经过现场实地考察,选取该墓葬边缘的南半测区用于布置观测系统,最终呈现三环“U形”。
![]() 图 4 小馒头墩越国贵族墓相关信息红色坐标系用于后文的反演。Figure 4. Information related to noble tomb of Yue Kingdom in Xiaomantou Hill
图 4 小馒头墩越国贵族墓相关信息红色坐标系用于后文的反演。Figure 4. Information related to noble tomb of Yue Kingdom in Xiaomantou Hill该观测系统总共布设189个电极,电极间距2 m,手动剔除扰动数据后,剩余5949个偶极数据和1081个温纳数据。南半测区测点的横向和纵向密度都较高,有效探测深度超过6 m,而北半区测点较为稀疏,甚至在“U形”开口区无数据观测点,稀疏数据覆盖会加剧反演的非唯一性、影响地球物理探测的效果。
此外,浙江省文物考古所根据现有的钻探资料勾画出了该墓葬内部结构的平面形制示意图,中部的长方形结构为墓室,南北两端的长条状结构为墓道(图4(b))。钻探资料显示墓室近南北向长约32 m,近东西向宽约10.5 m,在大约7.8 m深处钻芯出现了木质材料;南墓道最小深度约为3.5 m,宽约3.5,长约16.5 m;北墓道宽约3.7~4.5 m,长约19.5 m,钻孔得到的最小埋深为3 m[20]。本文采用多电极阵列联合反演尝试减少反演的模型解空间,为尚未成熟的“U形”观测系统野外数据的反演提供了新思路。
单独反演小馒头墩越国贵族墓温纳、偶极-偶极数据集并且根据钻探资料勾勒出墓室、墓道的大致轮廓(图5(a)和图5(b)及其白虚线)。两者反演结果大体比较相似,但在局部细节上有所区别。温纳单独反演结果的深度更靠近地面,而偶极-偶极单独反演的横向范围更小,例如,X方向纵切面体现出了两个低阻异常分开的状态。基于前文的模型测试和电阻率层析成像的充分研究[5-6,17,21],本文认为偶极-偶极单独反演的横向结果更为可靠、温纳单独反演的纵向结果更可信。偶极和温纳单独反演结果都在2 m以下才显示出较为明显的低阻异常,反演结果沿Y方向纵切片(近南北纵向)均未能精细刻画出相应的南墓道和墓室。特别地,偶极单独反演沿X方向纵切片(近东西纵向)显示出一个较为清晰的“牛角”状低阻异常和其包含在内的相对高阻的墓室。考虑到墓葬南侧广泛存在且未被填埋的盗洞(图4(a)),本文认为广泛存在的盗洞破坏了墓室和南墓道的结构完整性,导致雨水持续渗透,累积于通道、墓室中,进而形成了纵向犄角状低阻切片。其次,深度3 m处的横向切片都显示出了凹形低阻特征,其宽度约为钻探资料的3倍,这是因为三环“U形”测点分布部分重合造成的横向分辨率的降低,并且“U形”观测系统的固有缺陷导致观测点主要集中于南半区,加重了反演的多解性、形成了凹形特征。特别地,单独反演结果横切图似乎都展示了连接主墓室的潜在通道,但由于单独反演多解性和相关钻探资料缺乏,暂时无法确定独立于墓室、向近东西两侧延伸的低阻区是否为墓道。
![]() 图 5 越国贵族墓的反演结果从上至下分别为温纳单独反演、偶极-偶极单独反演、直接联合反演、加权联合反演结果;从左至右依次为反演结果立体图、沿Y方向纵切图、沿X方向纵切图、深度3 m处横切图。Figure 5. Inversion results of the noble tomb of Yue Kingdom
图 5 越国贵族墓的反演结果从上至下分别为温纳单独反演、偶极-偶极单独反演、直接联合反演、加权联合反演结果;从左至右依次为反演结果立体图、沿Y方向纵切图、沿X方向纵切图、深度3 m处横切图。Figure 5. Inversion results of the noble tomb of Yue Kingdom对温纳、偶极-偶极数据集进行直接联合反演(图5(c))和加权联合反演(图5(d)),相较于单独反演,两者均在沿X方向纵切图中更加精细地刻画出墓室的轮廓,符合钻探资料的描述、墓室与盗洞低阻异常分离明显、电阻率幅值恢复地更好。而在横切图中,加权联合反演相较于其他方法更好地约束了墓室宽度的反演结果,更接近于真实情况,电阻率阴影向外扩散的情况得到了抑制,证明多电极联合反演可以减少反演的多解性、增加反演结果的可靠性。此外,加权联合反演结果表明,墓室西侧低电阻率区域更多是伪影,近东侧的墓道更有可能真实存在,但也有可能是因为中部测点稀疏、两侧电极阵列密集造成的边缘区域效应,这需要在将来的工作进一步证实。
总的来说,加权联合反演依旧如同在理论模型的应用中展现出较单一观测阵列的优势,同时加权联合反演在实测野外数据的应用上提供了图像横向和纵向上的高分辨率。但无论是单独反演还是加权反演均未能成像出余天祥等[20]报告的墓室中部靠南区域的高阻响应,可能是此前盗洞或者塌陷的解释不成立,也可能是“U形”观测系统的固有分辨率缺陷。
4. 结论
为了实现不同电极阵列联合反演,特别是温纳和偶极-偶极观测阵列的联合反演,本文阐明加权联合反演的理论依据和实现过程,最后通过理论模型和实测野外数据分析温纳、偶极-偶极联合反演的特点,并得到以下结论:
(1)通过理论模型分析发现温纳观测阵列普遍纵向分辨率优于偶极-偶极观测阵列,而偶极-偶极观测阵列则在横向分辨上展现出优势,且加权联合反演结果都优于单一观测阵列的反演结果,证明了多电极联合反演的可行性和优越性;
(2)小馒头墩越国贵族墓实例证明联合反演可以缓解“U形”观测系统和反演本身带来的多解性,在墓室和墓道轮廓的刻画方面展现了相较于单独反演的优越性,但多电极联合反演仍无法彻底解决“U形”观测系统数据点集中导致的近南北向低分辨率问题;
(3)无论是理论模型还是实测数据,模型的连续电导率能够得到很好的重构,但对于跳跃的电导率会出现过光滑现象,需要使用L1模型范数。
-
![]()
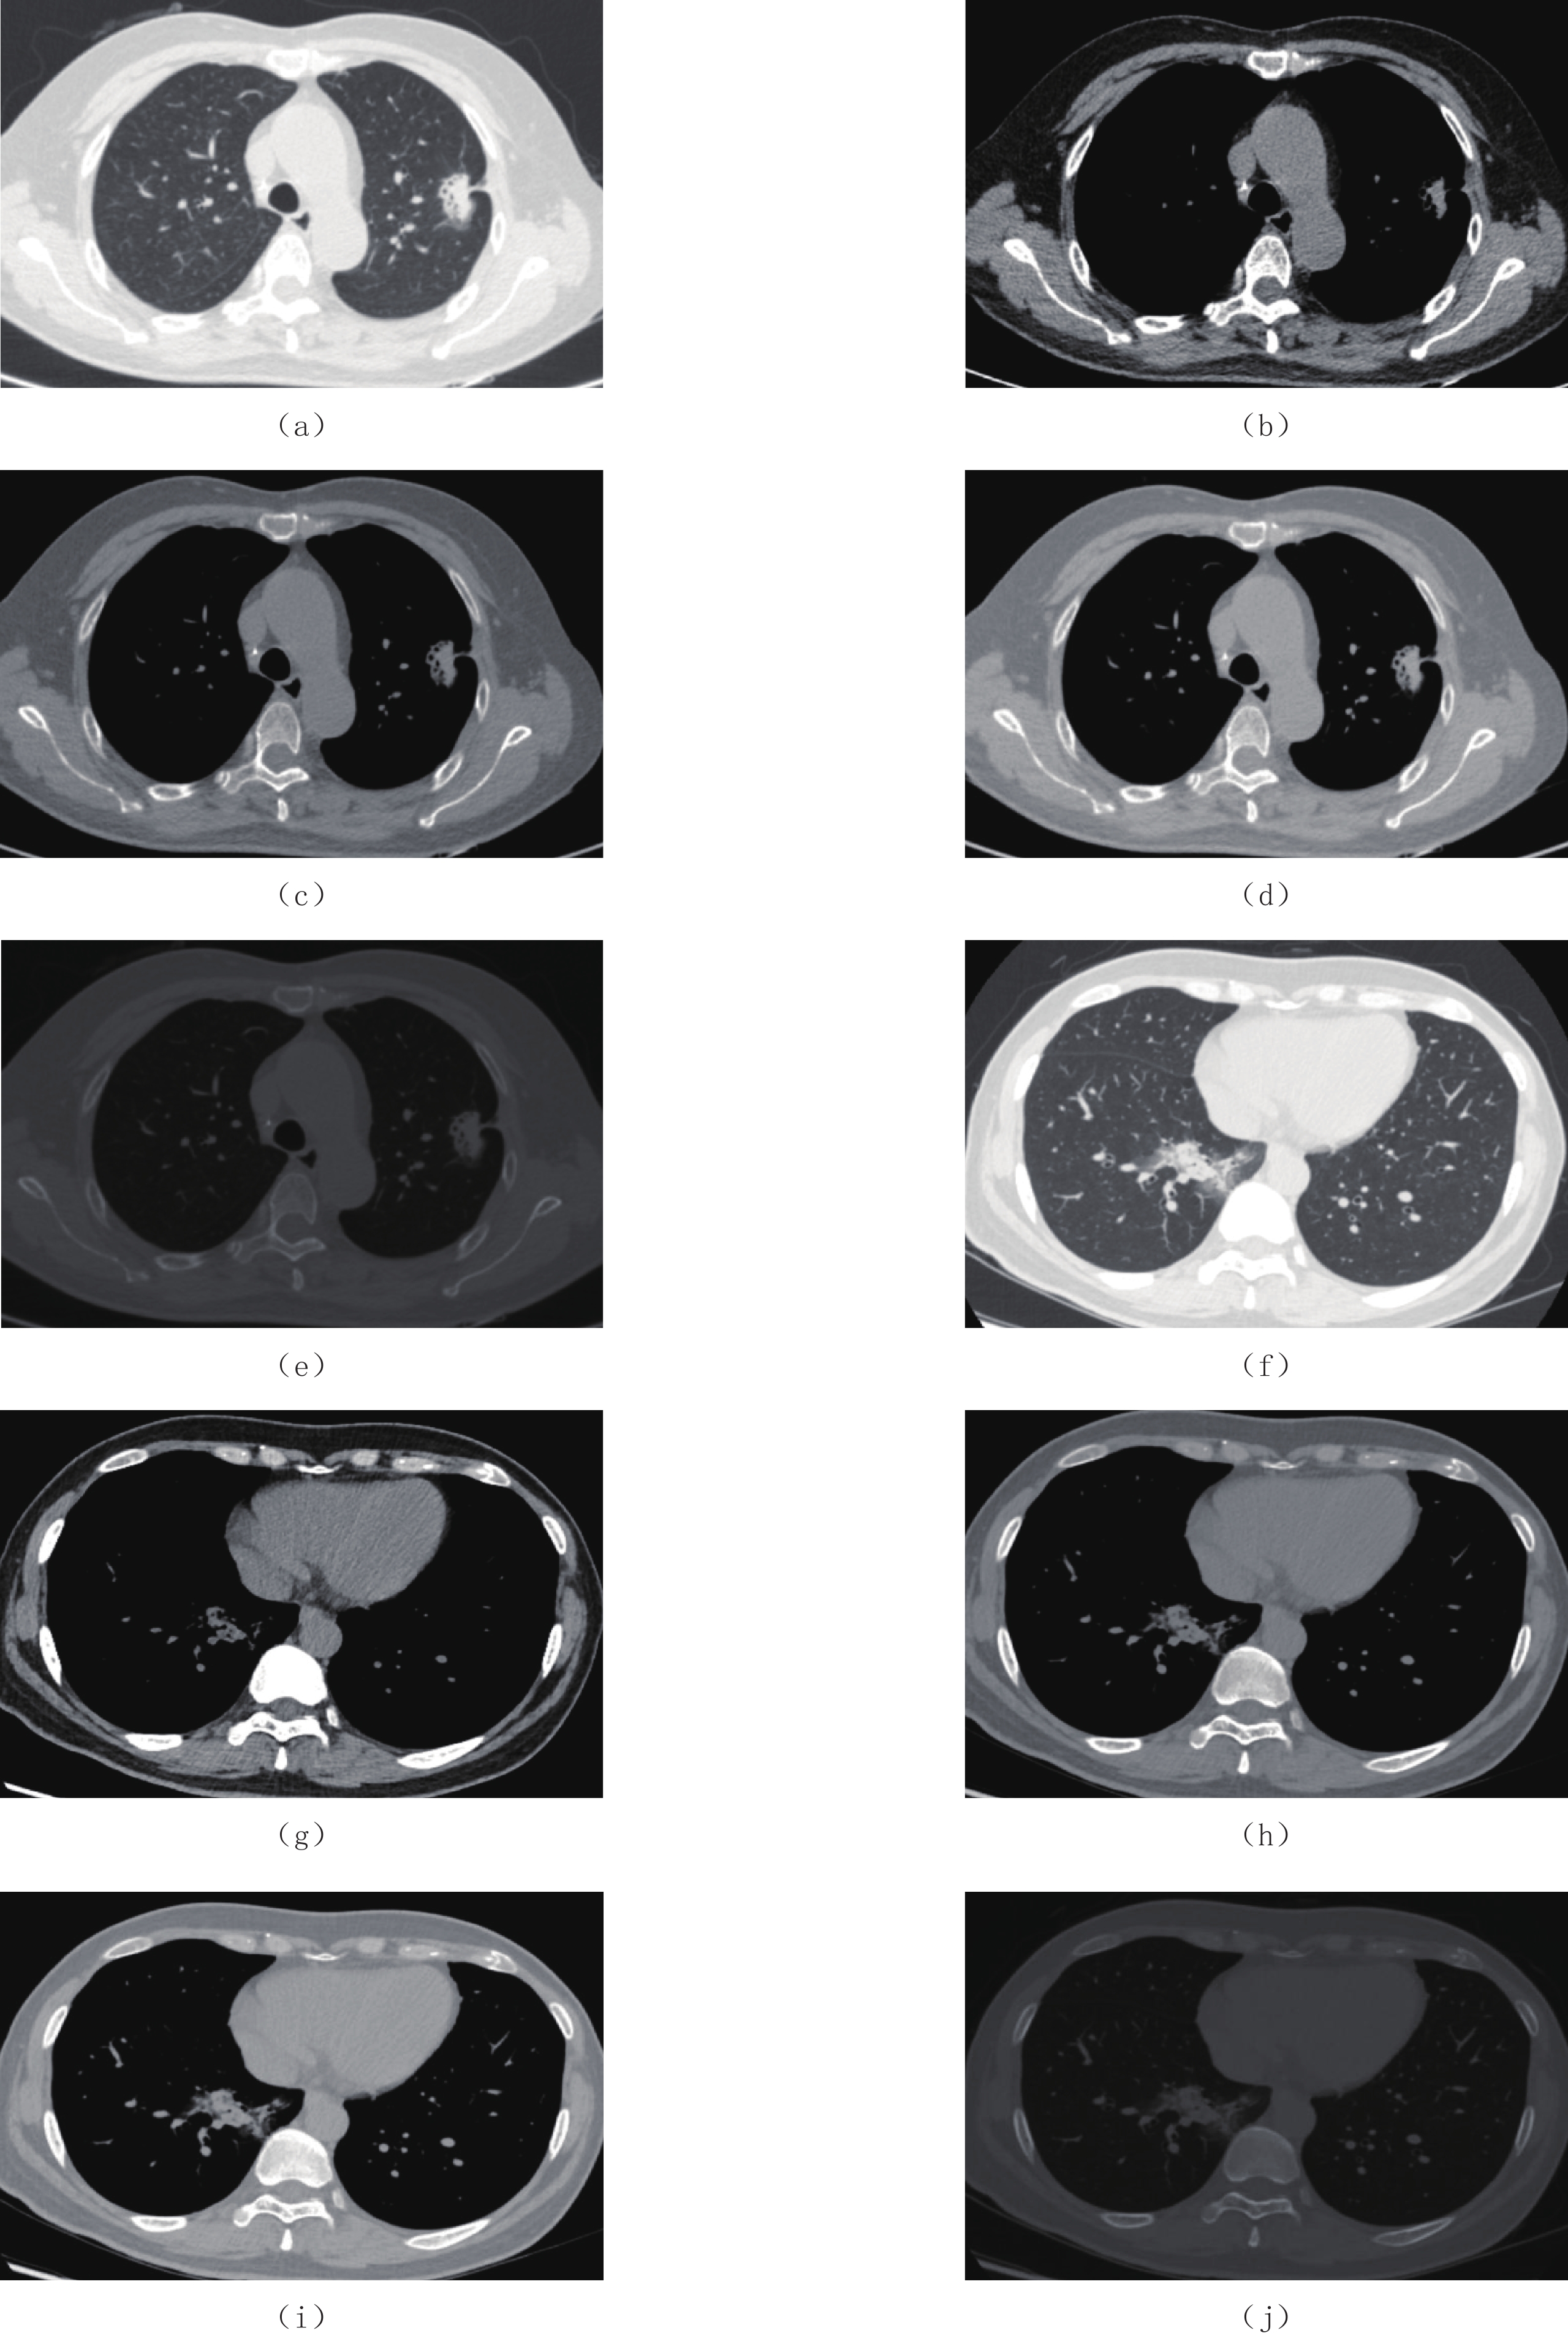
图 1 不同窗口设置时对病灶的显示不同:(a)~(e)左肺上叶周围型肺癌(腺癌);(f)~(j)右肺下叶局灶性肺炎
(a)和(f)肺窗;(b)和(g)纵隔窗;(c)和(h)SW1;(d)和(i)SW2;(e)和(j)全窗
Figure 1. Different display of lesions in different windows: (a)~(e) is the same patient, diagnosed as peripheral lung cancer in the upper lobe of the left lung (pathological examination shows adenocarcinoma); (f)~(j) is the same patient, diagnosed as focal pneumonia in the lower lobe of the right lung
![]()
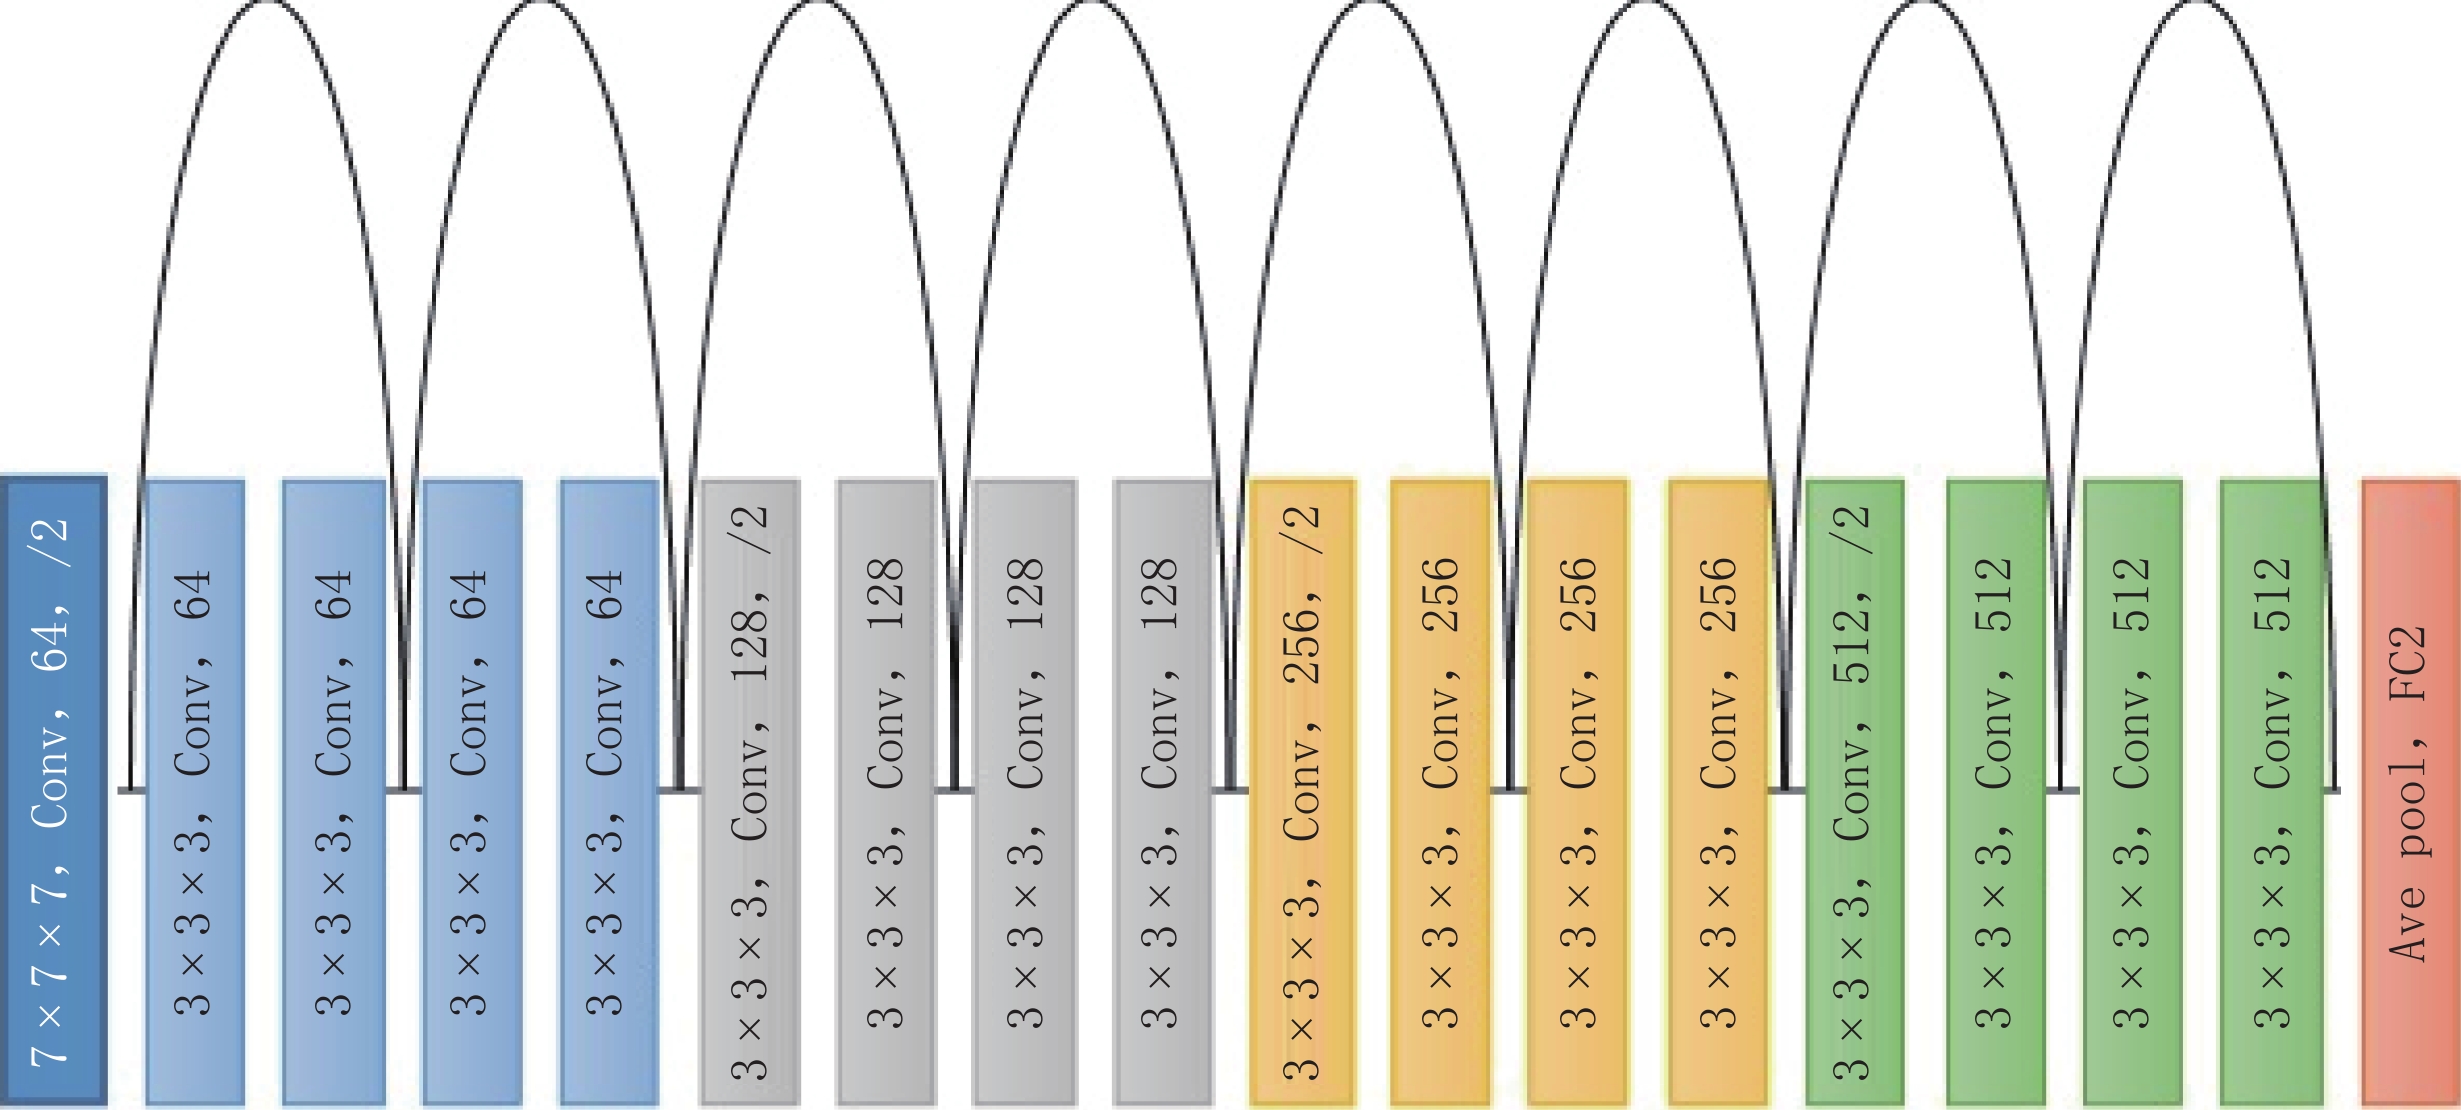
图 2 3D ResNet网络构建
主干使用18层的3D ResNet网络,在每个卷积块中,有1个卷积层(其参数在图中列出)、1个批标准化(Batch Normalization)层和1个ReLu激活层,图中的第1个参数“3×3×3”表示3D内核大小,第3个参数“64、128、256、512”表示通道数,最后1个参数“/2”表示步长为2的池层。
Figure 2. 3D ResNet network design
![]()
表 1 ResNet 5个窗口设置的5倍交叉验证的分类准确率(%)及AUC结果
Table 1 Classification accuracy (%) and AUC results of 5-fold cross validation of 5 window settings in ResNet
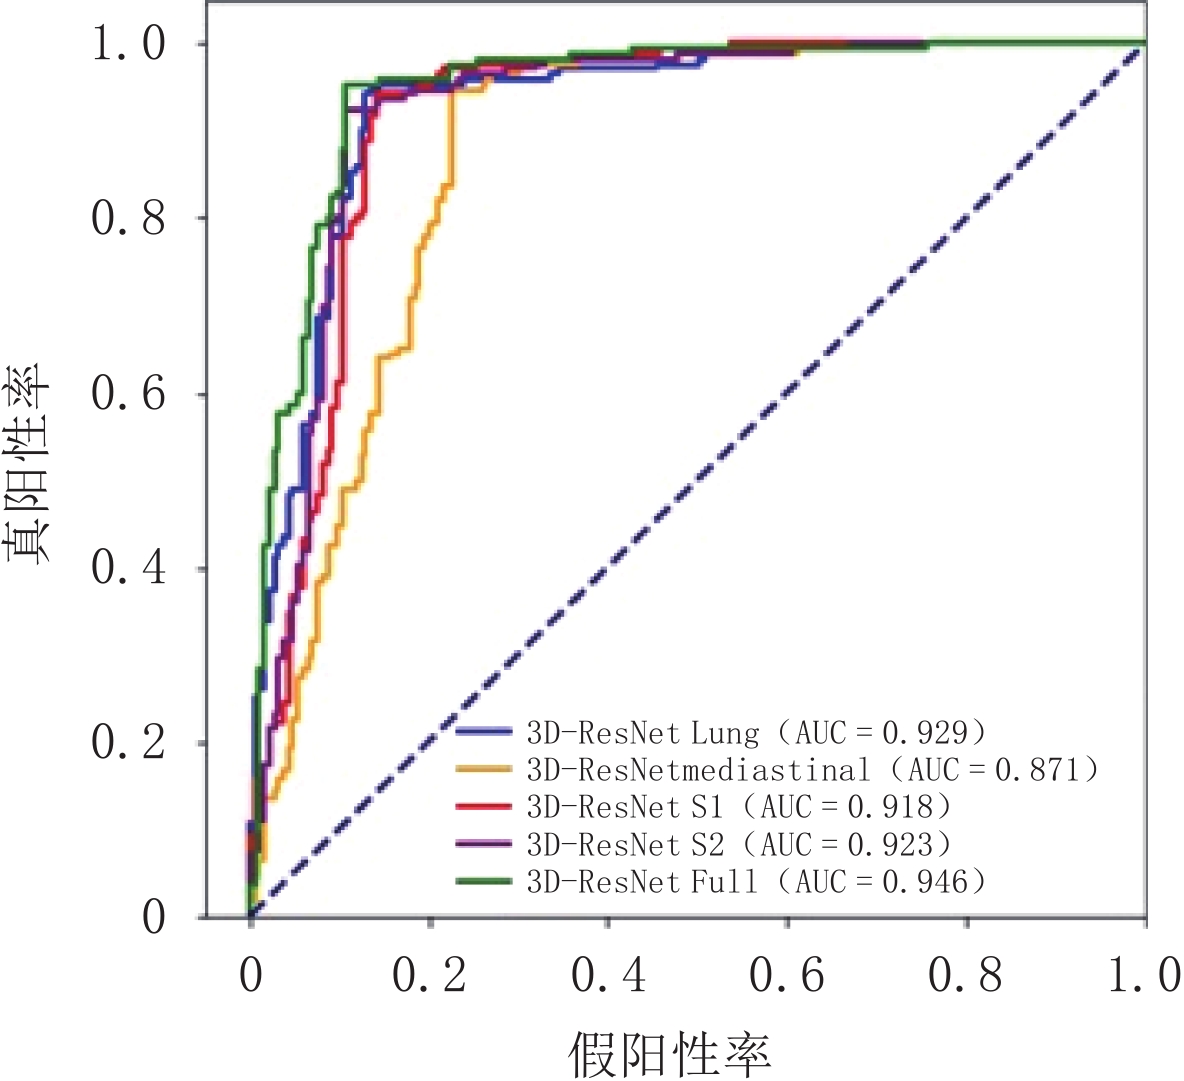
窗口 (WW,WL) Fold 1 Fold 2 Fold 3 Fold 4 Fold 5 平均分类准确率/% AUC 肺窗 (1500,−600) 87.50 88.73 91.55 91.55 93.06 90.478 0.929 纵隔窗 (350,40) 80.56 87.32 90.14 85.92 84.72 85.732 0.871 SW1 (1000,40) 86.11 92.96 88.73 91.55 90.28 89.926 0.918 SW2 (1000,−100) 87.50 92.96 90.14 91.55 90.28 90.486 0.923 Full (4096,1024) 87.50 90.14 90.14 94.37 95.83 91.596 0.946  下载: 导出CSV
表 2 ResNext 5个窗口设置的5倍交叉验证的分类准确率(%)及AUC结果
Table 2 Classification accuracy (%) and AUC results of 5-fold cross validation of 5 window settings in ResNext
窗口 (WW,WL) Fold 1 Fold 2 Fold 3 Fold 4 Fold 5 平均分类准确率/% AUC 肺窗 (1500,−600) 84.72 80.14 87.32 88.73 87.50 85.682 0.896 纵隔窗 (350,40) 77.78 83.10 81.69 84.51 80.56 81.528 0.814 SW1 (1000,40) 86.11 85.92 88.73 85.92 84.72 86.280 0.881 SW2 (1000,−100) 84.72 88.73 83.10 85.92 87.50 85.994 0.878 Full (4096,1024) 83.33 91.55 85.92 87.32 84.72 86.568 0.882
下载: 导出CSV
表 3 DenseNet 5个窗口设置的5倍交叉验证的分类准确率(%)及AUC结果
Table 3 Classification accuracy (%) and AUC results of 5-fold cross validation of 5 window settings in DenseNet
窗口 (WW,WL) Fold 1 Fold 2 Fold 3 Fold 4 Fold 5 平均分类准确率/% AUC 肺窗 (1500,−600) 87.50 91.55 92.96 94.37 93.06 91.888 0.944 纵隔窗 (350,40) 88.89 87.32 91.55 84.51 87.50 87.954 0.906 SW1 (1000,40) 94.44 94.37 90.14 90.14 93.06 92.430 0.932 SW2 (1000,−100) 93.06 95.77 91.55 91.55 94.44 93.274 0.951 Full (4096,1024) 91.67 92.96 90.14 94.37 94.44 92.716 0.941
下载: 导出CSV
-
[1] Van GINNEKEN B. Fifty years of computer analysis in chest imaging: Rule-based, machine learning, deep learning[J]. Radiological Physics and Technology, 2017, 10(1): 23−32. doi: 10.1007/s12194-017-0394-5
[2] YU X, LU S, GUO L, et al. ResGNet-C: A graph convolutional neural network for detection of COVID-19[J]. Neurocomputing, 2021, 452: 592−605. doi: 10.1016/j.neucom.2020.07.144
[3] LEE S M, SEO J B, YUN J, et al. Deep learning applications in chest radiography and computed tomography: Current state of the art[J]. Journal of Thoracic Imaging, 2019, 34(2): 75−85. doi: 10.1097/RTI.0000000000000387
[4] SHIN H C, ROTH H R, GAO M, et al. Deep convolutional neural networks for computer-aided detection: CNN architectures, dataset characteristics and transfer learning[J]. IEEE Transactions on Medical Imaging, 2016, 35(5): 1285−1298.
[5] KANG G, LIU K, HOU B, et al. 3D multi-view convolutional neural networks for lung nodule classification[J]. Plos One, 2017, 12(11): 12−22.
[6] CHENG X, WEN H, YOU H, et al. Recognition of peripheral lung cancer and focal pneumonia on chest computed tomography images based on convolutional neural network[J]. Technology in Cancer Research & Treatment, 2022, 21: 1-12.
[7] XIE S, GIRSHICK R, DOLLÁR P, et al. Aggregated residual transformations for deep neural networks[C]//In Proceedings of the IEEE Conference on Computer Vision and Pattern Recognition, 2017: 1492-1500.
[8] HUANG G, LIU Z, Van der MAATEN L, et al. Densely connected convolutional networks[C]//In Proceedings of the IEEE Conference on Computer Vision and Pattern Recognition, 2017: 4700-4708.
[9] 田培林, 徐覃莎, 唐利荣, 等. 胸部CT检查的肺窗技术[J]. 生物医学工程与临床, 2002,6(4): 209−213. doi: 10.3969/j.issn.1009-7090.2002.04.010 TIAN P L, XU Q S, TANG L R, et al. Window techniques for pulmonary image in chest CT[J]. Biomedical Engineering and Clinical Medicine, 2002, 6(4): 209−213. (in Chinese). doi: 10.3969/j.issn.1009-7090.2002.04.010
[10] 张胜超, 陈浩, 秦宣, 等. CT窗口技术在肺磨玻璃结节诊断中的临床意义[J]. 中国现代医学杂志, 2019,29(14): 106−109. ZHANG S C, CHEN H, QIN X, et al. Clinical significance of CT window technique in the diagnosis and treatment of pulmonary ground-glass nodules[J]. China Journal of Modern Medicine, 2019, 29(14): 106−109. (in Chinese).
[11] KITAMI A, SANO F, HAYASHI S, et al. Correlation between histological invasiveness and the computed tomography value in pure ground-glass nodules[J]. Surgery Today, 2016, 46(5): 593−598. doi: 10.1007/s00595-015-1208-1
[12] 张鹏, 徐欣楠, 王洪伟, 等. 基于深度学习的计算机辅助肺癌诊断方法[J]. 计算机辅助设计与图形学学报, 2018,30(1): 90−99. ZHANG P, XU X N, WANG H W, et al. Computer-aided lung cancer diagnosis approaches base on deep learning[J]. Journal of Computer-Aided Design & Computer Graphics, 2018, 30(1): 90−99. (in Chinese).
[13] 尹柯, 张久权, 伍建林, 等. 对比卷积神经网络分类模型与放射科医师鉴别浸润性肺腺癌的效能[J]. 中国医学影像技术, 2021,37(9): 1338−1342. YIN K, ZHANG J Q, WU J L, et al. Comparison on convolutional neural network classification model and radiologists in differentiating invasive lung adenocarcinoma[J]. Chinese Journal of Medical Imaging Technology, 2021, 37(9): 1338−1342. (in Chinese).
[14] 戴书华, 刘国芳, 向东生. 肺磨玻璃结节CT值测量在早期癌症诊断中的意义[J]. 中华肺部疾病杂志(电子版), 2019,12(6): 770−771. DAI S H, LIU G F, XIANG D S. The significance of CT value measurement of pulmonary ground glass nodule in early cancer diagnosis[J]. Chinese Journal of Lung Diseases Electronic Edition, 2019, 12(6): 770−771. (in Chinese).
[15] HE S, CHEN C, WANG Z, et al. The use of the mean computed tomography value to predict the invasiveness of ground-glass nodules: A meta-analysis[J]. Asian Journal of Surgery, 2022, 18: 1-6.
-
期刊类型引用(3)
1. 杨宇,黄杏. 胸部多层螺旋CT低剂量扫描的临床应用研究现状. 中国现代药物应用. 2023(17): 177-180 .  百度学术
百度学术
2. 潘兆鹏. 胸部多层螺旋CT低剂量扫描的研究现状及进展. 医疗装备. 2022(08): 192-194 . 百度学术
3. 龚芸. 不同迭代重组技术用于低剂量胸部CT平扫中的临床价值. 现代医用影像学. 2022(09): 1704-1706 . 百度学术
其他类型引用(1)


计量
- 文章访问数:
- HTML全文浏览量:
- PDF下载量:
- 被引次数: 4


