
Risk Factors of Plaque Progression in Patients with Angina Pectoris and Their Relationships with Coronary CT Angiography
-
摘要: 目的:探讨心绞痛患者斑块进展危险因素与冠状动脉CT血管成像指标的关系。方法:回顾性分析2017年1月至2020年1月我院收治心绞痛患者共236例临床资料,根据是否发生斑块进展分组,比较两组一般资料和冠状动脉CT血管成像指标,采用Logistic回归模型评价心绞痛患者斑块进展独立危险因素,描绘ROC曲线分析基于冠状动脉CT血管成像指标构建的预测模型在斑块进展风险预测中的价值。结果:两组性别、合并高血脂比例、服用他汀类药物比例、冠状动脉狭窄程度、最小管腔面积、斑块总体积、重塑指数(RI)及基于CT的血流储备分数(CT-FFR)水平比较差异有统计学意义;单因素分析结果显示,冠状动脉狭窄程度、最小管腔面积、斑块体积、非钙化斑块体积、RI及CT-FFR水平与心绞痛患者斑块进展有关;多因素分析结果显示,RI和CT-FFR水平是心绞痛患者斑块进展的独立影响因素;ROC曲线分析结果显示,冠状动脉狭窄程度+RI+CT-FFR联合用于斑块进展预测AUC优于单纯狭窄程度、狭窄程度+RI。结论:RI和CT-FFR水平是导致心绞痛患者斑块进展的重要影响因素,基于两者的预测模型可更为准确识别斑块进展。Abstract: Objective: To investigate the risk factors of plaque progression in patients with angina pectoris and their relationships with coronary computed tomography (CT) angiography. Methods: Clinical data of 236 patients with angina pectoris were retrospectively analyzed from January 2017 to January 2020. All patients were grouped according to whether plaque progression occurred, and the general information and coronary CT angiography indexes were compared between the two groups. A logistic regression model was used to evaluate the independent risk factors of plaque progression in patients with angina pectoris. The receiver operating characteristic (ROC) curve was delineated to analyze the clinical value of the prediction model based on coronary CT angiography indicators in predicting plaque progression risk. Results: There were significant differences in sex, the proportion of hyperlipidemia, proportion of statins, degree of stenosis, minimum lumen area, total plaque volume, RI, and CT-derived fractional flow reserve (FFR) between the two groups. The results of single factor analysis showed that the degree of stenosis, the minimum lumen area, plaque volume, the volume of non-calcified plaque, RI, and CT-FFR levels were related to the plaque progression in patients with angina pectoris. Univariate analysis showed that the degree of stenosis, minimum lumen area, plaque volume, non-calcified plaque volume, RI, and CT-FFR levels were associated with plaque progression in patients with angina pectoris. Multivariate analysis showed that RI and CT-FFR levels were independent factors of plaque progression in patients with angina pectoris. ROC curve analysis showed that the combination of stenosis degree + RI + CT-FFR was better than that of simple stenosis degree and stenosis degree + RI in predicting the area under the curve of plaque progression. Conclusion: RI and CT-FFR levels are important factors leading to plaque progression in patients with angina pectoris. The prediction model based on RI and CT-FFR can more accurately identify plaque progression.
-
Keywords:
- CT /
- angiography /
- angina pectoris /
- plaque /
- coronary artery
-
目前研究认为冠状动脉斑块进展机制复杂,可能受血流动力学异常、炎症损伤及内皮功能紊乱等影响;同时冠状动脉斑块进展特别是破裂均可导致心血管不良事件发生风险升高[1]。既往超声内镜、光学相干断层扫描(OCT)等有创检查手段可直观评估斑块大小、性质及斑块进展,但存在医源性创伤明显、价格昂贵等缺陷[2]。近年来冠状动脉CT血管成像已被广泛用于冠心病诊断及随访,而通过后处理分析功能还可定性及定量评估斑块,显示出与超声内镜接近评估效能[3];而基于CT的血流储备分数(CT-FFR)属于新型冠状动脉血流动力改变评估技术,能够实现特异性缺血病变无创评估,有研究显示CT-FFR值可能与冠状动脉斑块恶化及心脏不良事件发生有关[4]。
基于以上证据,本次研究回顾性分析2017年1月至2020年1月我院收治心绞痛患者共236例,根据是否发生斑块进展分组,旨在探讨心绞痛患者斑块进展危险因素及与冠状动脉CT血管成像指标的关系。
1. 资料与方法
1.1 一般资料
研究2017年1月至2020年1月我院收治心绞痛患者共236例。纳入标准:①因症状加重、新发症状或随访来院接受两次冠状动脉CT血管成像检查;②两次检查时间>12个月;③年龄≥18岁;④临床资料完整。排除标准:①两次检查间行冠状动脉血运重建;②冠状动脉 CT血管成像质量欠佳导致无法评估;③主动脉夹层;④瓣膜病变;⑤先天性心脏病;⑥不愿配合检查治疗。研究设计符合《赫尔辛基宣言要求》。
1.2 分组
入选患者根据是否发生斑块进展分组,其中斑块进展组74例,无斑块进展组162例;斑块进展判定标准为斑块负荷(PB)变化率>1%。
1.3 方法
查阅病例记录患者性别、年龄、合并基础疾病、既往史、用药情况、实验室检查指标及冠状动脉CT血管成像指标;甘油三酯(TG)、总胆固醇(TC)及超敏C反应蛋白(hs-CRP)水平检测采用贝克曼AU3000型全自动生化分析仪,其中hs-CRP检测采用免疫比浊法,TG和TC检测采用超速离心法。
冠状动脉CT血管成像采用西门子SOMATOM Definition 双源CT扫描仪。扫描前给予硝酸甘油扩张冠状动脉,保证HR<90次/min,依次行冠状动脉钙化积分平扫及心电门控检查。扫描参数设置:管电压100~130 kV,管电流100~350 mAs,矩阵512×512,管转速0.28 s/转。注射碘佛醇(370 mg/mL)50~70 mL,对比剂流率4~5 mL/s。
获得图像经西门子CPA 4.2.1软件处理完成斑块定量分析,由两名高年资心血管诊断影像医师阅片。定量分析指标包括狭窄程度、长度、总体积、钙化体积、最小管腔面积、重塑指数(RI)及PB,其中,狭窄程度=(近端正常管腔 - 最窄处管腔)/近端正常管腔,最小管腔面积指斑块区域导致血管腔最狭窄处管腔面积,RI=最狭窄处管腔面积/近远端参考血管面积均值,PB=斑块体积/血管体积[5]。
CT-FFR分析采用西门子cFFR软件,通过自动识别冠状动脉中心线和管腔后手工修正,建立伪彩冠状动脉树,测量位置一般选择斑块远端2~4 cm区域。
1.4 统计学处理
数据分析采用SPSS 20.0软件。正态性评估采用Kolmogorov-Smirnov检验,其中,符合正态分布计量资料比较采用独立样本t检验,以
$(\bar{\textit{χ}}\pm s)$ 表示;计数资料比较采用$\textit{χ}^2$ 检验,以百分比表示;多因素分析采用Logistic回归模型;描绘ROC曲线评价斑块进展预测价值。P<0.05为差异有统计学意义。2. 结果
2.1 两组一般资料和冠状动脉CT血管成像指标比较
两组性别、合并高血脂比例、服用他汀类药物比例、狭窄程度、最小管腔面积、斑块总体积、RI及CT-FFR水平比较差异有统计学意义;两组其他指标比较差异无统计学意义(表1)。
表 1 两组一般资料和冠状动脉CT血管成像指标比较Table 1. Comparison of general data and CT angiographic indexes between the two groups指标 指标值 P 斑块进展组(n=74) 无斑块进展组(n=162) 男性/例 40 72 0.02 年龄/岁 69.06±7.46 67.95±6.87 0.43 BMI/(kg/m2) 24.10±2.33 23.85±2.46 0.57 合并高血压/例 50 108 0.92 合并高血脂/例 40 54 0.04 合并糖尿病/例 40 52 0.10 吸烟/例 36 58 0.34 心绞痛家族史/例 20 62 0.93 服用他汀类药物/例 26 36 0.01 TG/(mmol/L) 1.47±0.29 1.30±0.33 0.14 TC/(mmol/L) 5.07±1.39 4.98±1.45 0.93 hs-CRP/(mg/L) 2.61±0.45 2.48±0.49 0.86 斑块长度/mm 32.04±7.50 29.11±5.74 0.27 狭窄程度/(%) 51.35±8.17 43.80±7.40 0.01 最小管腔面积/mm2 5.08±1.06 6.67±1.45 0.00 斑块总体积/mm3 305.35±67.57 261.50±53.63 0.01 斑块钙化体积/mm3 132.40±20.67 102.44±23.61 0.29 RI 1.33±0.40 1.10±0.35 0.03 PB/(%) 51.85±7.26 49.11±7.04 0.19 CT-FFR 0.88±0.13 0.91±0.16 0.00 2.2 心绞痛患者斑块进展危险因素Logistic回归模型分析
单因素分析结果显示,狭窄程度、最小管腔面积、斑块体积、非钙化斑块体积、RI及CT-FFR水平与心绞痛患者斑块进展有关;多因素分析结果显示,RI和CT-FFR水平是心绞痛患者斑块进展独立影响因素(表2)。
表 2 心绞痛患者斑块进展危险因素Logistic回归模型分析Table 2. Logistic regression model analysis on risk factors of plaque progression in patients with angina pectoris组别 单因素 P 多因素 P HR 95% CI HR 95% CI 狭窄程度 2.04 0.72~1.90 0.03 1.37 0.50~4.56 0.73 最小管腔面积 0.81 0.27~2.10 0.03 0.78 0.82~3.94 0.59 斑块体积 2.36 0.60~2.35 0.04 1.62 0.69~4.80 0.44 非钙化斑块体积 2.80 0.42~2.77 0.02 1.84 0.94~5.26 0.80 RI 4.54 1.28~4.54 0.00 2.49 1.17~3.86 0.02 CT-FFR 4.94 0.67~5.90 0.00 2.77 1.12~5.08 0.01 2.3 基于冠状动脉CT血管成像指标预测模型斑块进展预测价值ROC曲线分析
ROC曲线分析结果显示,狭窄程度+RI+CT-FFR联合用于斑块进展预测AUC优于单纯狭窄程度、狭窄程度+RI(表3)。
表 3 基于冠状动脉CT血管成像指标预测模型斑块进展预测价值ROC曲线分析Table 3. ROC curve analysis of plaque progression prediction value based on coronary CT angiography index prediction model模型 AUC 95% CI P 狭窄程度 0.65 0.54~0.71 0.04 狭窄程度+RI 0.78 0.66~0.85 0.01 狭窄程度+RI+CT-FFR 0.85 0.74~0.96 0.00 2.4 典型病例
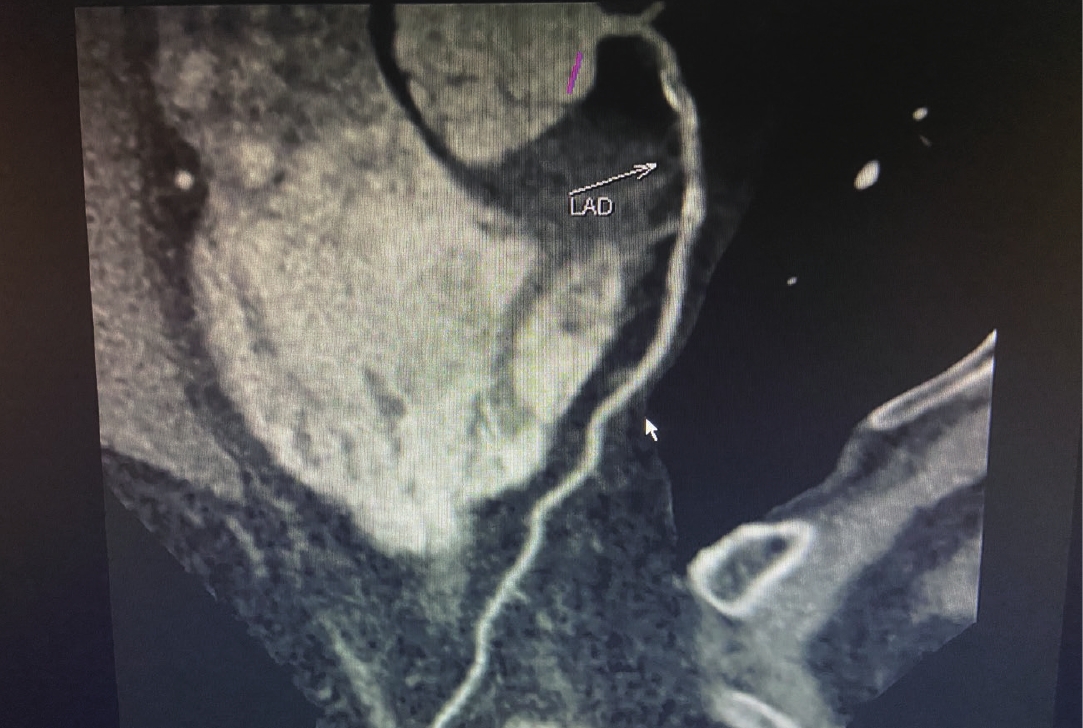
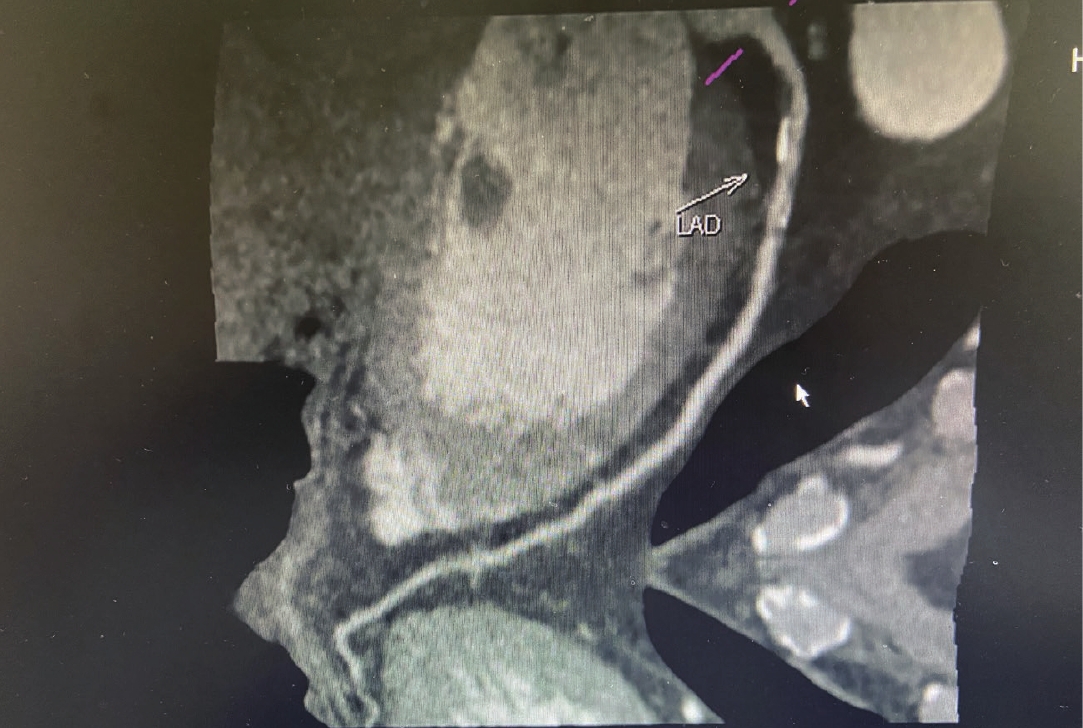
患者男,55岁,初诊时可见左冠状动脉前降支(LAD)近段可见软化、钙化及混合性斑块(钙化总积分为71.4),局部管腔狭窄约50%~85% 左右;间隔12个月复查可见左冠状动脉前降支(LAD)近段可见多发斑片状钙化斑块(钙化总积分为58.7),局部管腔狭窄约45%~55%(图1(初诊)和图2(复查))。
3. 讨论
本次研究纳入236例患者接受冠状动脉CT血管成像,结果显示74例出现斑块进展。已有研究显示[6],冠状动脉粥样硬化进展与炎性细胞因子、内皮功能及周围应力等因素有关。冠状动脉CT血管成像是冠状动脉斑块检查常用手段之一,已被广泛用于冠状动脉病变评估[7];相关研究提示[8],冠状动脉CT血管成像斑块评估结果与超声内镜基本一致,且可重复性较高;另有学者认为总斑块负荷与冠状动脉斑块进展密切相关;故本次研究根据患者斑块负荷变化评估斑块进展情况,以便于后续指导治疗方案制定及调整。
本次研究结果中,两组狭窄程度、最小管腔面积、斑块总体积、RI及CT-FFR水平比较差异有统计学意义;单因素分析结果显示,狭窄程度、最小管腔面积、斑块体积、非钙化斑块体积、RI及CT-FFR水平与心绞痛患者斑块进展有关;多因素分析结果显示,RI水平是心绞痛患者斑块进展独立影响因素,其中RI水平升高是导致斑块进展独立危险因素。既往研究认为,冠状动脉正性重塑是斑块发生进展危险征象,这可能与机体异常氧化应激反应、炎症损伤对于冠状动脉局部微环境影响有关[9-10]。但本次研究未证实斑块负荷对于斑块进展的影响,我们分析认为这主要与入组患者基线斑块负荷水平较低有关。
此外需要注意本次研斑块进展组年龄更大,血脂异常比例更高且服用他汀类药物比例更低。有报道证实[11],他汀类药物应用可在一定程度上控制脂质斑块体积,延缓斑块进展,避免高危斑块出现。因此我们认为在临床实践过程中应当重视对于高龄人群早期血脂水平监测及他汀类药物服用,最大限度降低远期不良事件发生风险。
早期研究证实CT-FFR水平能够准确预测冠状动脉缺血性病变发生,其中CT-FFR≤0.8者往往合并缺血性病变,具有较高准确度和特异度[12-13]。冠状动脉CT血管成像评估血管狭窄程度可能与功能学指标存在差异,即使轻中度狭窄斑块亦可诱发斑块进展及ACS发生[14-15];故在临床实践中应进一步分析血流动力学指标对于斑块进展的影响。部分学者研究认为[16],以CT-FFR为代表血流动力学指标可辅助用于冠状动脉斑块危险程度预测。本次研究多因素分析结果显示,CT-FFR水平是心绞痛患者斑块进展独立影响因素,提示CT-FFR水平更低者更易出现斑块进展,可能作用机制为基线病灶CT-FFR值下降导致内皮功能稳定性下降,影响斑块周围微环境,导致斑块体积增大、进展甚至破裂[17]。
本次研究ROC曲线分析结果显示,狭窄程度+RI+CT-FFR联合用于斑块进展预测AUC优于单纯狭窄程度、狭窄程度+RI,提示CT-FFR辅助预测冠状动脉斑块进展风险可有效提高预测效能,有助于提高临床危险分层准确性,为后续预防治疗提供更多参考。
本次研究存在的不足:①属于单中心、小样本及回顾性报道,难以完全排除混杂因素影响;②无法与FFR、超声内镜及OCT检查资料进行对照,同时未分析冠状动脉CT血管造影检查后药物及生活方式干预对斑块进展影响,有待后续更为深入严谨研究进一步确证。
综上所述,RI和CT-FFR水平是导致心绞痛患者斑块进展重要影响因素,基于两者预测模型可更为准确识别斑块进展。
-
表 1 两组一般资料和冠状动脉CT血管成像指标比较
Table 1 Comparison of general data and CT angiographic indexes between the two groups
指标 指标值 P 斑块进展组(n=74) 无斑块进展组(n=162) 男性/例 40 72 0.02 年龄/岁 69.06±7.46 67.95±6.87 0.43 BMI/(kg/m2) 24.10±2.33 23.85±2.46 0.57 合并高血压/例 50 108 0.92 合并高血脂/例 40 54 0.04 合并糖尿病/例 40 52 0.10 吸烟/例 36 58 0.34 心绞痛家族史/例 20 62 0.93 服用他汀类药物/例 26 36 0.01 TG/(mmol/L) 1.47±0.29 1.30±0.33 0.14 TC/(mmol/L) 5.07±1.39 4.98±1.45 0.93 hs-CRP/(mg/L) 2.61±0.45 2.48±0.49 0.86 斑块长度/mm 32.04±7.50 29.11±5.74 0.27 狭窄程度/(%) 51.35±8.17 43.80±7.40 0.01 最小管腔面积/mm2 5.08±1.06 6.67±1.45 0.00 斑块总体积/mm3 305.35±67.57 261.50±53.63 0.01 斑块钙化体积/mm3 132.40±20.67 102.44±23.61 0.29 RI 1.33±0.40 1.10±0.35 0.03 PB/(%) 51.85±7.26 49.11±7.04 0.19 CT-FFR 0.88±0.13 0.91±0.16 0.00  下载: 导出CSV
表 2 心绞痛患者斑块进展危险因素Logistic回归模型分析
Table 2 Logistic regression model analysis on risk factors of plaque progression in patients with angina pectoris
组别 单因素 P 多因素 P HR 95% CI HR 95% CI 狭窄程度 2.04 0.72~1.90 0.03 1.37 0.50~4.56 0.73 最小管腔面积 0.81 0.27~2.10 0.03 0.78 0.82~3.94 0.59 斑块体积 2.36 0.60~2.35 0.04 1.62 0.69~4.80 0.44 非钙化斑块体积 2.80 0.42~2.77 0.02 1.84 0.94~5.26 0.80 RI 4.54 1.28~4.54 0.00 2.49 1.17~3.86 0.02 CT-FFR 4.94 0.67~5.90 0.00 2.77 1.12~5.08 0.01
下载: 导出CSV
表 3 基于冠状动脉CT血管成像指标预测模型斑块进展预测价值ROC曲线分析
Table 3 ROC curve analysis of plaque progression prediction value based on coronary CT angiography index prediction model
模型 AUC 95% CI P 狭窄程度 0.65 0.54~0.71 0.04 狭窄程度+RI 0.78 0.66~0.85 0.01 狭窄程度+RI+CT-FFR 0.85 0.74~0.96 0.00
下载: 导出CSV
-
[1] 高艳, 顾慧, 杨世锋, 等. 基于冠状动脉CT血管成像的斑块定量分析及其与心肌缺血损伤的相关性研究[J]. 中华放射学杂志, 2020,54(2): 129−135. doi: 10.3760/cma.j.issn.1005-1201.2020.02.008 GAO Y, GU H, YANG S F, et al. Correlation study of coronary plaque quantitative analysis and myocardial ischemic injury based on coronary CT angiography[J]. Chinese Journal of Radiology, 2020, 54(2): 129−135. (in Chinese). doi: 10.3760/cma.j.issn.1005-1201.2020.02.008
[2] ZHAN R, QI R, HUANG S, et al. The correlation between hepatic fat fraction evaluated by dual-energy computed tomography and high-risk coronary plaques in patients with non-alcoholic fatty liver disease[J]. Japanese Journal of Radiology, 2021, 5(4): 1123−1130.
[3] KIM U, LEIPSIC J A, SELLERS S L, et al. Natural history of diabetic coronary atherosclerosis by quantitative measurement of serial coronary computed tomographic angiography: Results of the PARADIGM study[J]. Journal of the American College of Cardiology Cardiovasc Imaging, 2018, 11(10): 1461−1471. doi: 10.1016/j.jcmg.2018.04.009
[4] KLÜNER L V, OIKONOMOU E K, ANTONIADES C. Assessing cardiovascular risk by using the fat attenuation index in coronary CT angiography[J]. Radiology Cardiothoracic Imaging, 2021, 3(1): e200563. doi: 10.1148/ryct.2021200563
[5] YAMAMOTO M H, YAMASHITA K, MATSUMURA M, et al. Serial 3-vessel optical coherence tomography and intravascular ultrasound analysis of changing morphologies associated with lesion progression in patients with stable angina pectoris[J]. Circulation-Cardiovascular Imaging, 2017, 10(9): e006347. doi: 10.1161/CIRCIMAGING.117.006347
[6] MEAH M N, WILLIAMS M C. Clinical relevance of coronary computed tomography angiography beyond coronary artery stenosis[J]. Rofo-fortschr Rontg, 2021, 26(3): 1174−1183.
[7] KITAHARA S, KATAOKA Y, MIURA H, et al. The feasibility and limitation of coronary computed tomographic angiography imaging to identify coronary lipid-rich atheroma in vivo: Findings from near-infrared spectroscopy analysis[J]. Atherosclerosis, 2021, 322(4): 1−7.
[8] TESCHE C, de CECCO C N, ALBRECHT M H, et al. Coronary CT angiography-derived fractional flow reserve[J]. Radiology, 2017, 285(1): 17−33. doi: 10.1148/radiol.2017162641
[9] YANG L, XU P P, SCHOEPF U J, et al. Serial coronary CT angiography-derived fractional flow reserve and plaque progression can predict long-term outcomes of coronary artery disease[J]. European Radiology, 2021, 25(2): 1156−1163.
[10] KOLOSSVÁRY M, GERSTENBLITH G, BLUEMKE D A, et al. Contribution of risk factors to the development of coronary atherosclerosis as confirmed via coronary CT angiography: A longitudinal radiomics-based study[J]. Radiology, 2021, 299(1): 97−106. doi: 10.1148/radiol.2021203179
[11] LIU X, WU G, XU C, et al. Prediction of coronary plaque progression using biomechanical factors and vascular characteristics based on computed tomography angiography[J]. Computer Assistant Surgery (Abingdon), 2017, 22(S1): 286−294.
[12] BENTON S M, TESCHE C, DE CECCO C N, et al. Noninvasive derivation of fractional flow reserve from coronary computed tomographic angiography: A review[J]. Journal of Thoracic Imaging, 2018, 33(2): 88−96. doi: 10.1097/RTI.0000000000000289
[13] LEE S E, CHANG H J, SUNG J M, et al. Effects of statins on coronary atherosclerotic plaques: The PARADIGM study[J]. Journal of the American College of Cardiology Cardiovasc Imaging, 2018, 11(10): 1475−1484. doi: 10.1016/j.jcmg.2018.04.015
[14] CICCARELLI G, BARBATO E, TOTH G G, et al. Angiography versus hemodynamics to predict the natural history of coronary stenoses: Fractional flow reserve versus angiography in multivessel evaluation 2 substudy[J]. Circulation, 2018, 137(14): 1475−1485. doi: 10.1161/CIRCULATIONAHA.117.028782
[15] TANG C X, WANG Y N, ZHOU F, et al. Diagnostic performance of fractional flow reserve derived from coronary CT angiography for detection of lesion-specific ischemia: A multi-center study and meta-analysis[J]. European Journal of Radiology, 2019, 116(10): 90−97.
[16] IMAI S, KONDO T, STONE G W, et al. Abnormal fractional flow reserve in nonobstructive coronary artery disease[J]. Circulation Cardiovascular Intervention, 2019, 12(2): e006961. doi: 10.1161/CIRCINTERVENTIONS.118.006961
[17] NOZUE T, TAKAMURA T, FUKUI K, et al. Changes in coronary atherosclerosis, composition, and fractional flow reserve evaluated by coronary computed tomography angiography in patients with type 2 diabetes[J]. International Journal of Cardiology Heart Vascular, 2018, 19(4): 46−51.
-
期刊类型引用(4)
1. 李正腾,王敏,潘冬梅,王宪凯. CCTA斑块特征在冠状动脉管腔狭窄程度进展预测及预后的价值研究. CT理论与应用研究(中英文). 2025(01): 23-30 .  百度学术
百度学术
2. 赵细辉,周瑶,王骋. 基于双源CT下CCTA斑块特征分析对冠状动脉狭窄致心绞痛的诊断价值. 影像技术. 2025(02): 54-57 . 百度学术
3. 姜小瑞,冯秀元. 对比64排CT冠状动脉成像下不同性质心绞痛患者斑块特征. CT理论与应用研究. 2024(S1): 20-23 . 本站查看
4. 唐太娟. 64排螺旋CT冠状动脉成像低剂量技术的应用价值分析. 中外医药研究. 2024(23): 144-146 . 百度学术
其他类型引用(0)


计量
- 文章访问数: 170
- HTML全文浏览量: 85
- PDF下载量: 31
- 被引次数: 4


