
Quantitative Analysis of Computed Tomography Features of Different COVID-19 Infection Virus Variants Using Artificial Intelligence
-
摘要: 目的:人工智能(AI)定量分析比较新型冠状病毒感染德尔塔(Delta)和奥密克戎(Omicron)变异株感染患者的胸部CT影像学特征。方法:回顾性分析2022年2月20日至2022年4月19日在内蒙古自治区第四医院确诊的294例新型冠状病毒Delta变异株感染患者及2022年12月1日至12月30日在内蒙古自治区人民医院确诊的222例Omicron变异株感染患者的临床资料及首次CT影像学资料进行分析,分为Delta组和Omicron组,应用推想预测肺部感染辅助诊断软件进行定量计算,比较分析组间CT影像学征象及CT定量数据。结果:磨玻璃斑片影、磨玻璃结节影、索条、实变、铺路石征、小叶间隔增厚及病灶内增粗血管影等影像学征象在两组之间比较无统计学意义。Omicron组病灶分布较Delta组更容易出现沿支气管血管束分布;Delta组的全肺病灶体积、体积占比、右肺中叶病灶体积、体积占比、右肺下叶病灶体积、体积占比均高于Omicron组;Delta组患者病灶分布于 -570~-470 HU体积、-470~-370 HU体积、-370~-270 HU体积、-270~-170 HU体积均高于Omicron组。结论:Delta变异株感染患者肺炎早期CT病灶体积及体积占比Omicron组高,Omicron组病灶分布较Delta组更容易出现不典型的沿支气管血管束分布,人工智能肺炎辅助诊断系统对COVID-19患者定量评估肺炎感染区域体积及体积占比,为患者病情评估提供客观的参考数据。Abstract: Objective: To quantitatively analyze and compare the chest computed tomography (CT) imaging features of patients infected with delta and omicron variants of COVID-19 using artificial intelligence (AI). Method: The clinical data of 294 patients infected with the novel coronavirus delta variant diagnosed at the Fourth Hospital of Inner Mongolia Autonomous Region from February 20, 2022 to April 19, 2022 and 222 patients infected with the omicron variant diagnosed at the People's Hospital of Inner Mongolia Autonomous Region from December 1, 2022 to December 30, 2022 were retrospectively analyzed. CT imaging data were analyzed and divided into delta and omicron groups. Quantitative calculation was performed using deductive predictive pulmonary infection auxiliary diagnostic software, and CT imaging signs and quantitative CT data between groups were compared and analyzed. Results: No statistical significance was noted between the delta and omicron groups in imaging signs, such as ground-glass opacity, ground-glass nodule, cord-like lesion, consolidation, paving stone sign, thickened interlobular septum, and thickened vessels in the lesion. The distribution of lesions along the bronchial vascular bundle was more likely in the omicron than in the delta group. The total lung lesion volume, volume proportion, right middle lobe lesion volume, volume proportion, right inferior lobe lesion volume, and volume proportion in the delta group were higher than those in the omicron group. The proportions of lesions in the delta group in −570 ~ −470 HU, −470 ~ −370 HU, −370 ~ −270 HU, and −270 ~ −170 HU volumes were higher than those in the omicron group. Conclusion: In the early stage of COVID-19, the volume of CT lesions in the patients infected with the delta variant was higher than that in the omicron group, and the distribution of lesions in the omicron group was more likely to have atypical distribution along the bronchial vascular bundle than that in the delta group. The volume and volume proportion of the pneumonia-infected area in patients with COVID-19 were quantitatively evaluated using the AI-assisted diagnosis system for COVID-19 to provide objective reference data for patients' condition assessment.
-
Keywords:
- quantitative CT /
- computer aided diagnosis /
- novel coronavirus /
- Delta /
- Omicron
-
坏死性筋膜炎(necrotizing fasciitis,NF)是危及生命的侵袭性软组织感染,其坏死区域主要累及筋膜及肌肉。这是一种罕见的疾病,常好发于躯干、会阴及四肢,而对于颈部坏死性筋膜炎(cervical necrotizing fasciitis,CNF)来说,由于发病部位的血供丰富,因此其发病率更低,仅占NF的1%~10%[1]。牙源性以及扁桃体感染是常见的发病原因,颌下以及咽旁间隙是最好发的感染部位,发生于鼻咽部较为罕见。
CNF如果不及时诊断以及治疗,病变区域有可能沿着颈深区域向纵隔蔓延,从而导致严重的后果。不受控制的高血糖会导致患者的免疫系统随着年龄的增长越来越虚弱,这往往是该疾病的主要诱发因素[2]。由于CNF在发病初期并无特异性的体征以及实验室指标的异常,因此影像学检查,尤其是CT检查在该病的精准诊断中显得尤为重要。
1. 病史资料
1.1 临床资料
患者男性,58岁,1年余前无明显诱因出现左侧头痛,伴有左耳流脓,无鼻塞、流涕、涕中带血,无耳痛、耳内流血等不适。于当地医院诊断为“慢性化脓性中耳炎”,予以抗炎治疗后头痛稍有减轻。此后患者上述症状持续存在,均予以抗炎治疗,但头痛并未缓解。
10月前患者自觉上述症状加重,并出现左侧面瘫及吞咽困难,之后对症治疗后均未见好转。既往双侧慢性化脓性中耳炎50余年;糖尿病史5年,合并糖尿病性视网膜病史,平时胰岛素控制;高血压病史4年。
1.2 实验室检查
血常规:红细胞3.70×10¹²/L(下降),血红蛋白108 g/L(上升),红细胞压积32.6%(下降),淋巴细胞15.9%(下降),其余正常。血生化:谷丙转氨酶6.3 U/L(下降),谷草转氨酶10.6 U/L(下降),总胆汁酸6.8 umol/L(上升),总蛋白61.3 g/L(下降),白蛋白33.6 g/L(下降),肌酐101 umol/L(上升),葡萄糖4.39 mmol/L,糖化血红蛋白21.9%(上升),其余正常。肿瘤指标:AFP、CEA、CA199、CA125、CA724、PSA、fPSA、fPSA/PSA、CTFRA21-1、SCC、CA50均阴性。
1.3 影像学表现
CT图像显示鼻咽腔基本对称,双侧咽隐窝略变浅(图1);两侧咽旁间隙及咽后间隙软组织肿胀,颅底斜坡骨质破坏,蓝色箭头处可见无强化的筋膜征象(图1(d))。
MRI图像示鼻咽腔基本对称,双侧咽隐窝略变浅(图2);两侧咽旁间隙及咽后间隙软组织肿胀,肌间脂肪消失,增强后咽旁间隙可见散乱不均匀的异常强化,病变沿肌间隙走行,鼻咽粘膜未见异常增厚。蓝色箭头见颅骨斜坡右侧及左下可见稍长T1稍短T2信号影,增强后强化不均匀,周围见强化的软组织信号影(图2(e)和图2(f)),两侧乳突气房可见液性信号影。
PET/CT图像显示FDG异常代谢区域位于鼻咽深部软组织伴邻近颅底斜坡骨质破坏(图3),鼻咽粘膜未见异常代谢(图3(a)~图3(f));头颈部PET图像显示颈部未见肿大淋巴结影(图3(g))。CT、MRI以及PET/CT检查,均误诊为鼻咽癌。
1.4 诊疗过程
患者行鼻内镜下鼻咽部肿物活检术,于鼻咽部可见包裹性脓腔及坏死组织,取部分病理组织送病理及脓性分泌物送细菌培养,广泛彻底清除病灶至正常黏膜。
病理诊断:局部见炎性渗出,局部纤维结缔组织增生及粘液变性,胶原变性。
1.5 随访
患者出院1月后门诊复查,疼痛及吞咽困难的症状缓解,面瘫有所好转。半年后电话跟踪随访,患者疼痛及吞咽困难的症状消失,面瘫基本缓解,仅左眼睑闭合不佳。
2. 讨论
2.1 病因及发病机制
NF是一种组织坏死并且进展迅速的疾病,病原体入侵软组织并且引起血管血栓,最终导致脂肪组织、筋膜及皮肤坏死[3]。CNF更是一种罕见的累及颈部筋膜的微生物感染,它的易感因素包括糖尿病、不良的口腔卫生、酗酒、肿瘤以及静脉吸毒[4]。
CNF最常见原因是牙源性感染(27.5%),其次是扁桃体疾病(22.5%)、皮肤感染(8.75%)和腮腺感染(6.25%)[5]。最常见的并发症是气道阻塞以及下行性坏死性纵隔炎[6]。纵隔炎的预后非常差,因此它与感染性休克一样都是CNF最为严重的并发症[7-8]。
2.2 临床特征
由于CNF预后不良,及时诊断并且早期干预就显得尤为重要。压痛、发热和皮肤红斑是早期NF的常见体征[9]。回顾本病例,可能是由于发病位置的特殊(鼻咽部),患者并无上诉症状,而是表现为左侧头痛伴左耳流脓。
Wong等[10]为了对包括CNF在内的NF进行早期诊断,提出了坏死性感染实验室风险指标(LRINEC)评分。LRINEC评分是以6项实验室指标的异常进行评分,其中包括血清C反应蛋白(>150 mg/L)、白细胞(WBC)计数(>15000/μL)、血红蛋白(<13.5 g/dL)、血清钠水平(<135 mmol/L)、血清肌酐水平(142 mmol/L)和血清葡萄糖水平(10 mmol/L)。LRINEC评分大于等于8分,发生NSTI的风险为75%。虽然之后一些研究对LRINEC评分进行评估,证实了该评分在NF感染初期诊断中的有效性,但是近期的一些研究又发现该指标的敏感性较差,并不能作为排除NF的有效手段[11,12-13]。通过回顾本例患者的实验室指标也验证了这一结论,患者的LRINEC评分仅为2分,远没有达到诊断NF的水平。
2.3 影像学表现
对于临床体征及实验室指标均不明确的早期NF患者,影像学检查可以发挥重要作用。如怀疑为NF,CT扫描是一个有价值的影像学工具。一项关于坏死性筋膜炎的CT研究发现,CT的敏感性达到了100%,特异性为98%,因此CT阴性结果可以有效的排除坏死性筋膜炎,CT阳性结果对诊断坏死性筋膜炎具有很高的价值[14]。当CT图像中出现脂肪受累、沿着筋膜平面走行的液体以及气体聚集,尤其是增强图像出现无强化的筋膜增厚等征象,需要考虑NF[14]。
而MR则被认为是诊断NF最佳的影像学检查,当T2加权像上出现深筋膜增厚>3 mm并伴有多个肌筋膜室受累,此为诊断NF的重要征象[15]。虽然MRI的表现优于CT,但是MRI在某些紧急情况下难以进行,因此不建议将其作为首选的影像学检查技术[11]。我们回顾该患者CT及MRI图像,图像中虽然出现两侧咽旁间隙及咽后间隙肿胀,伴双侧欠对称,咽隐窝变浅,合并颅底骨破坏等表现,这些都是与鼻咽癌相同的征象,但是图像中另外可见典型的深筋膜增厚的表现,尤其是MR上可见散乱不均匀的异常强化,病变沿肌间隙走行,这些均提示需要与坏死性筋膜炎进行鉴别。
在该患者的PET/CT图像上,虽然鼻咽部肿胀伴有较大范围的FDG代谢增高,同时合并颅底骨的破坏,但是FDG异常代谢的区域主要局限在鼻咽深部区域,粘膜并未见FDG异常代谢,这点从MR中信号正常的鼻咽粘膜中得到了印证(图2(c)和图2(d))。
2.4 治疗及转归
本例患者通过鼻咽肿物活检术发现鼻咽部包裹性浓腔及坏死组织,并且病灶进行广泛彻底地清除,完成对CNF的诊断以及治疗。术后患者症状明显缓解,出院后继续接受头孢曲松抗感染治疗。
2.5 诊断与鉴别诊断
目前NF的诊断主要依赖症状学、实验室指标、影像学以及侵入性诊断。然而早期的NF体征与症状几乎没有特异性,通常难以明确诊断。因此当出现肿胀、发热以及与症状不成比例的剧烈疼痛时,需要高度怀疑NF。既往LRINEC评分曾经作为NF诊断的重要依据,但是该评分诊断的敏感性较低,并不能作为排除NF的有效手段。当NF诊断不明确时,影像学检查可以提供相对有价值的信息。
一项包含23项研究总计纳入5982名患者的META分析评估了体格检查、影像学检查以及LRINEC评分在NF诊断中的准确性[13]。该研究发现影像学检查具有敏感性及特异性,尤其是CT的敏感性为88.5%,特异性为93.3%;而体格检查以及LRINEC评分敏感性较差,均不能应用于排除NF。侵入性诊断——手术探查是诊断NF的金标准,当手指可轻易分离筋膜(手指实验阳性)、组织缺血坏死以及恶臭分泌物,均提示NF的诊断[16]。由于该例患者CNF发生于鼻咽部,需要与以下疾病进行鉴别。
2.5.1 鼻咽癌
鼻咽癌病理类型目前以未分化癌及鳞状细胞癌为主,EB病毒感染与鼻咽癌发病率密切相关。早期鼻咽癌基本无症状,也可能因为咽鼓管阻塞引起一系列症状,其中包括鼻塞、鼻出血、中耳炎、听力下降等。影像学表现:CT及MR表现基本相似,表现为鼻咽部两侧欠对称,局部见软组织肿块突入鼻腔内,咽隐窝变浅或消失;当咽旁间隙受累时,其脂肪间隙消失,再向外可累及翼腭窝及颞下窝,向后可累及颅底;增强扫描多表现为不均匀强化。PET/CT表现为FDG高代谢。
2.5.2 鼻咽淋巴瘤
鼻咽淋巴瘤是仅次于鼻咽癌第2常见的鼻咽部恶性肿瘤,它的发病率与EB病毒感染也密切相关。影像学表现,它好发于鼻咽顶壁咽扁桃体和咽鼓管扁桃体附近粘膜内聚集的淋巴小结,往往表现为一种弥漫对称分布的肿块[17]。同时它通常沿着粘膜或脂肪间隙扩散至口咽部及下咽扁桃体,极少累及深层结构,因此鼻咽淋巴瘤很少累及颅底。增强扫描多为均匀性的强化表现,PET/CT也表现为FDG高代谢。
3. 结论
鼻咽部坏死性筋膜炎缺乏早期诊断的特征性表现,但是影像学检查,尤其是CT对该病的早期诊断具有重要价值。
-
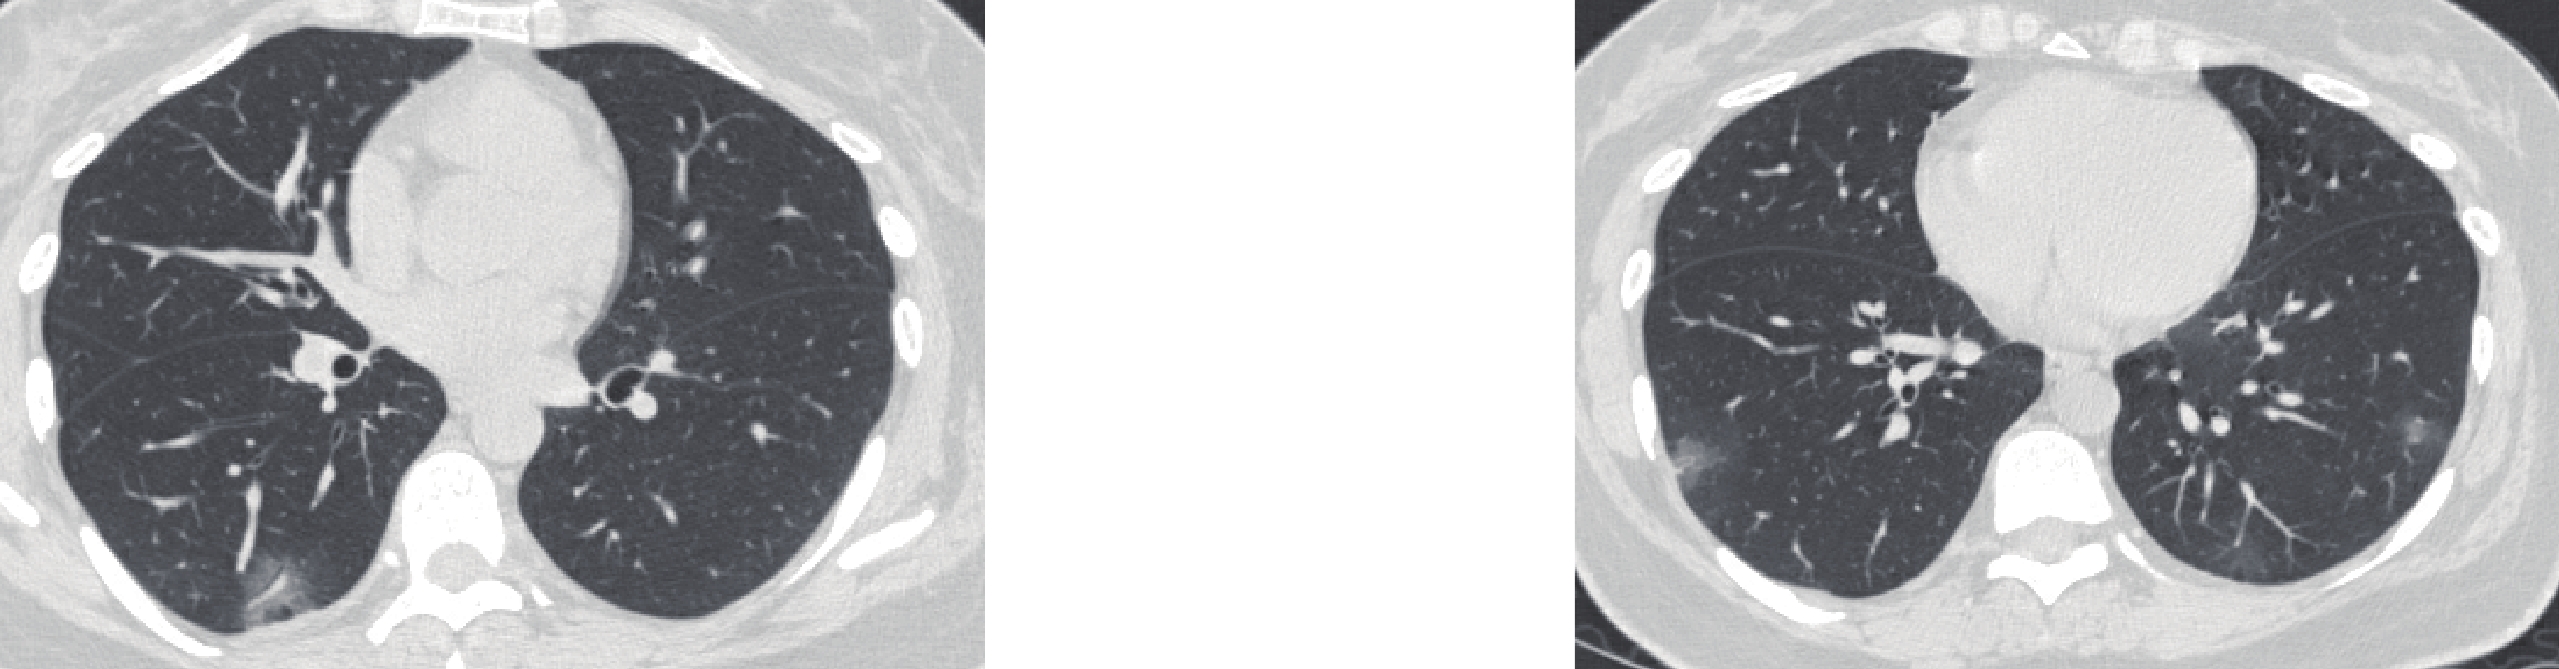
![]()
图 1 (a)女,24岁,Omicron组患者,新型冠状病毒感染核酸检测阳性1天,入院体温37.3°,右肺上叶后段磨玻璃密度结节。(b)男,55岁,Delta组患者,周身酸痛伴气短1周+新冠病毒核酸检测阳性 1天,入院体温38.3°,双肺下叶磨玻璃结节影
Figure 1. (a) A 24-year-old female patient in the Omicron group had a positive nucleic acid test result for novel coronavirus pneumonia for 1 day. She was admitted to the hospital with a temperature of 37.3° and a nodule of ground glass density in the posterior segment of the upper lobe of the right lung. (b) Male, 55-year-old patient in the delta group, with body pain and shortness of breath for 1 week + positive COVID-19 nucleic acid test for 1 day; admission temperature: 38.3°, ground glass nodules in the lower lobes of both lungs
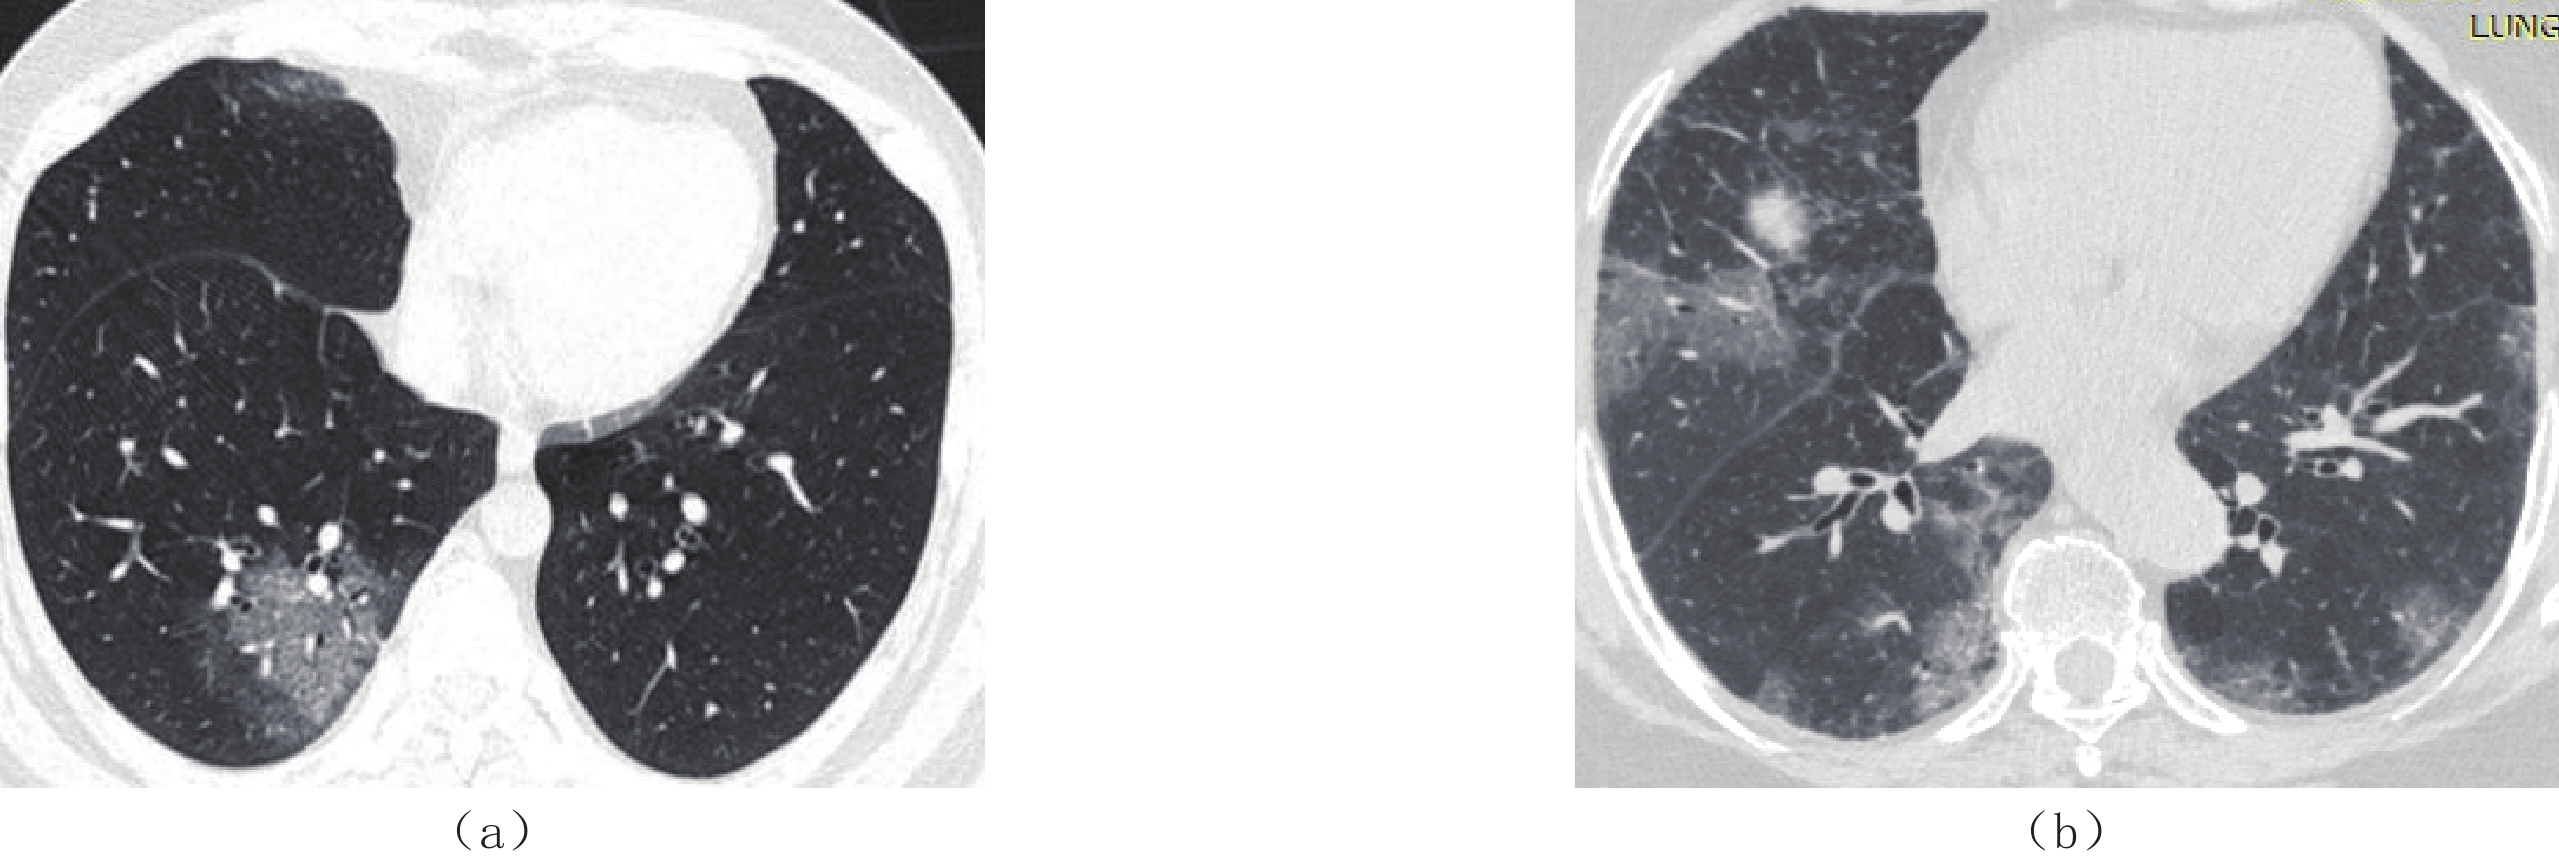
![]()
图 2 女,41岁,Omicron组患者,新型冠状病毒核酸检测阳性1天,咳嗽2天。双肺下叶斑片状磨玻璃影,胸膜下分布,病灶内可见增粗血管影
Figure 2. Female patient, 41-year-old, in the Omicron group, tested positive for novel coronavirus nucleic acid for 1 day and coughed for 2 days. Patchy ground-glass opacity was observed in the lower lobes of both lungs, subpleura distributed, and thickened vascular shadows were observed in the lesions
![]()
图 3 (a)男,42岁,Omicron组患者,咽痛2天,新冠病毒核酸阳性1天。既往体建,右肺下叶胸膜下“铺路石征”。(b)女,65岁,新冠核酸阳性1天,发热、咳嗽半日。双肺多发斑片状磨玻璃影及实变影,胸膜下分布为著,病灶内增粗血管影
Figure 3. (a) A 42-year-old male patient in the Omicron group had sore throat for 2 days and tested positive for COVID-19 nucleic acid for 1 day. Previous body construction, subpleural "paving stone sign" in the inferior lobe of the right lung. (b) A 65-year-old female who tested positive for COVID-19 for 1 day experienced fever and cough for half a day. Multiple patchy ground glass shadows and consolidation shadows in both lungs, with subpleural distribution and thickened vascular shadows in the lesions
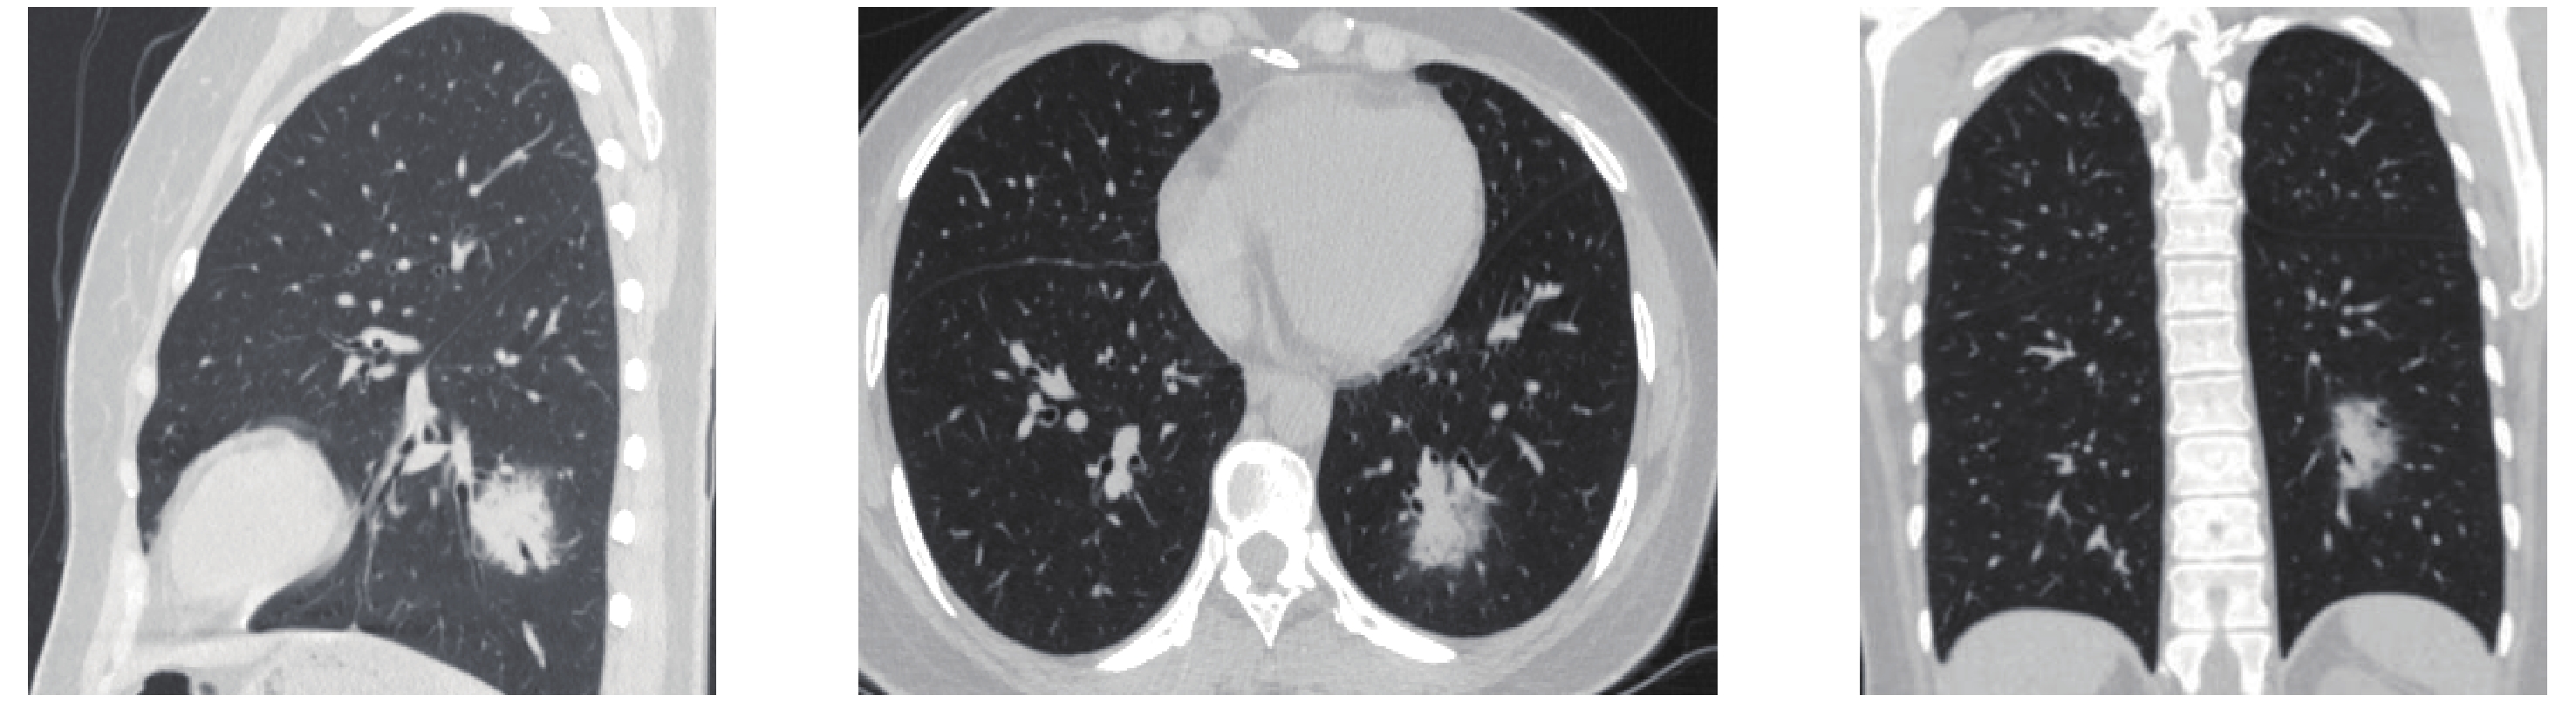
![]()
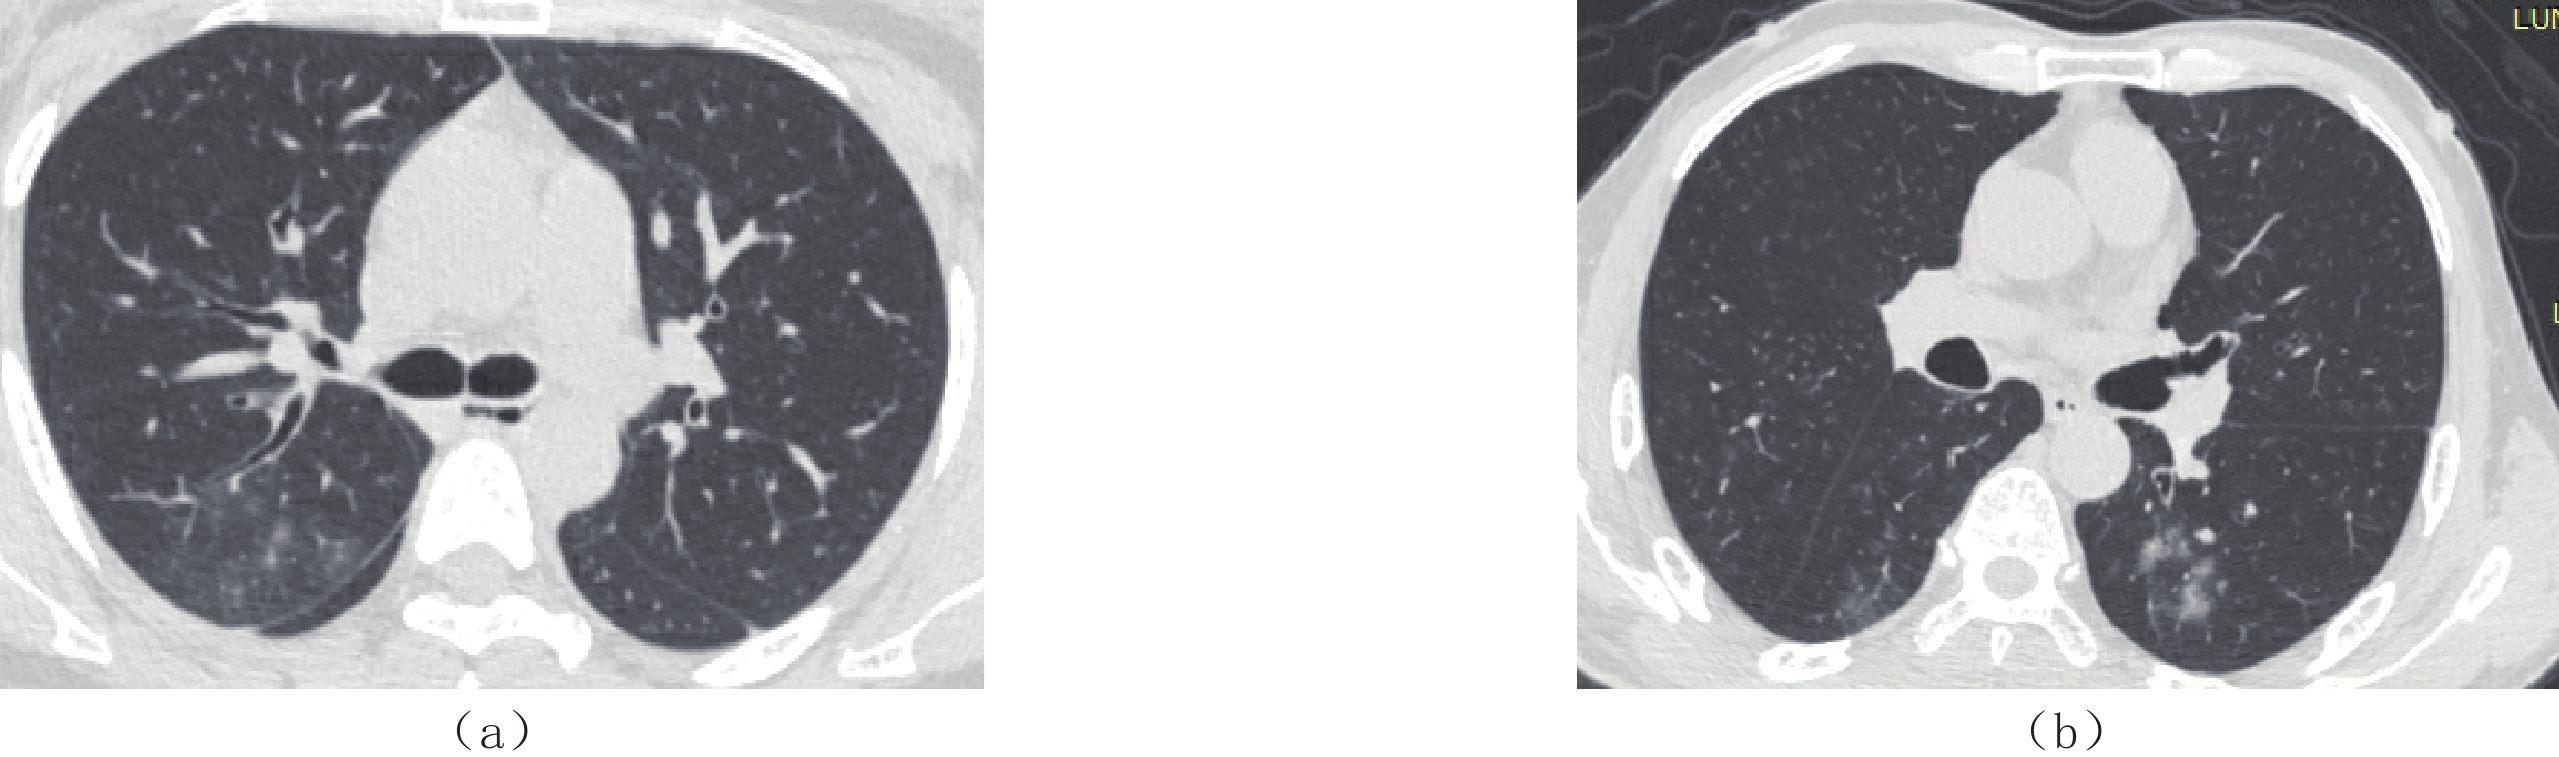
图 4 37岁女性,Omicron组患者,新型冠状病毒感染核酸检测阳性1天,咳嗽1天,CT MPR图像显示左肺下叶沿支气管血管束分布的斑片状磨玻璃密度及实变影
Figure 4. A 37-year-old woman in the omicron group tested positive for COVID-19 nucleic acid for 1 day and coughed for 1 day. CT images showed patchy ground glass, and consolidation is peribronchovascular bundle distribution in the lower lobe of the left lung
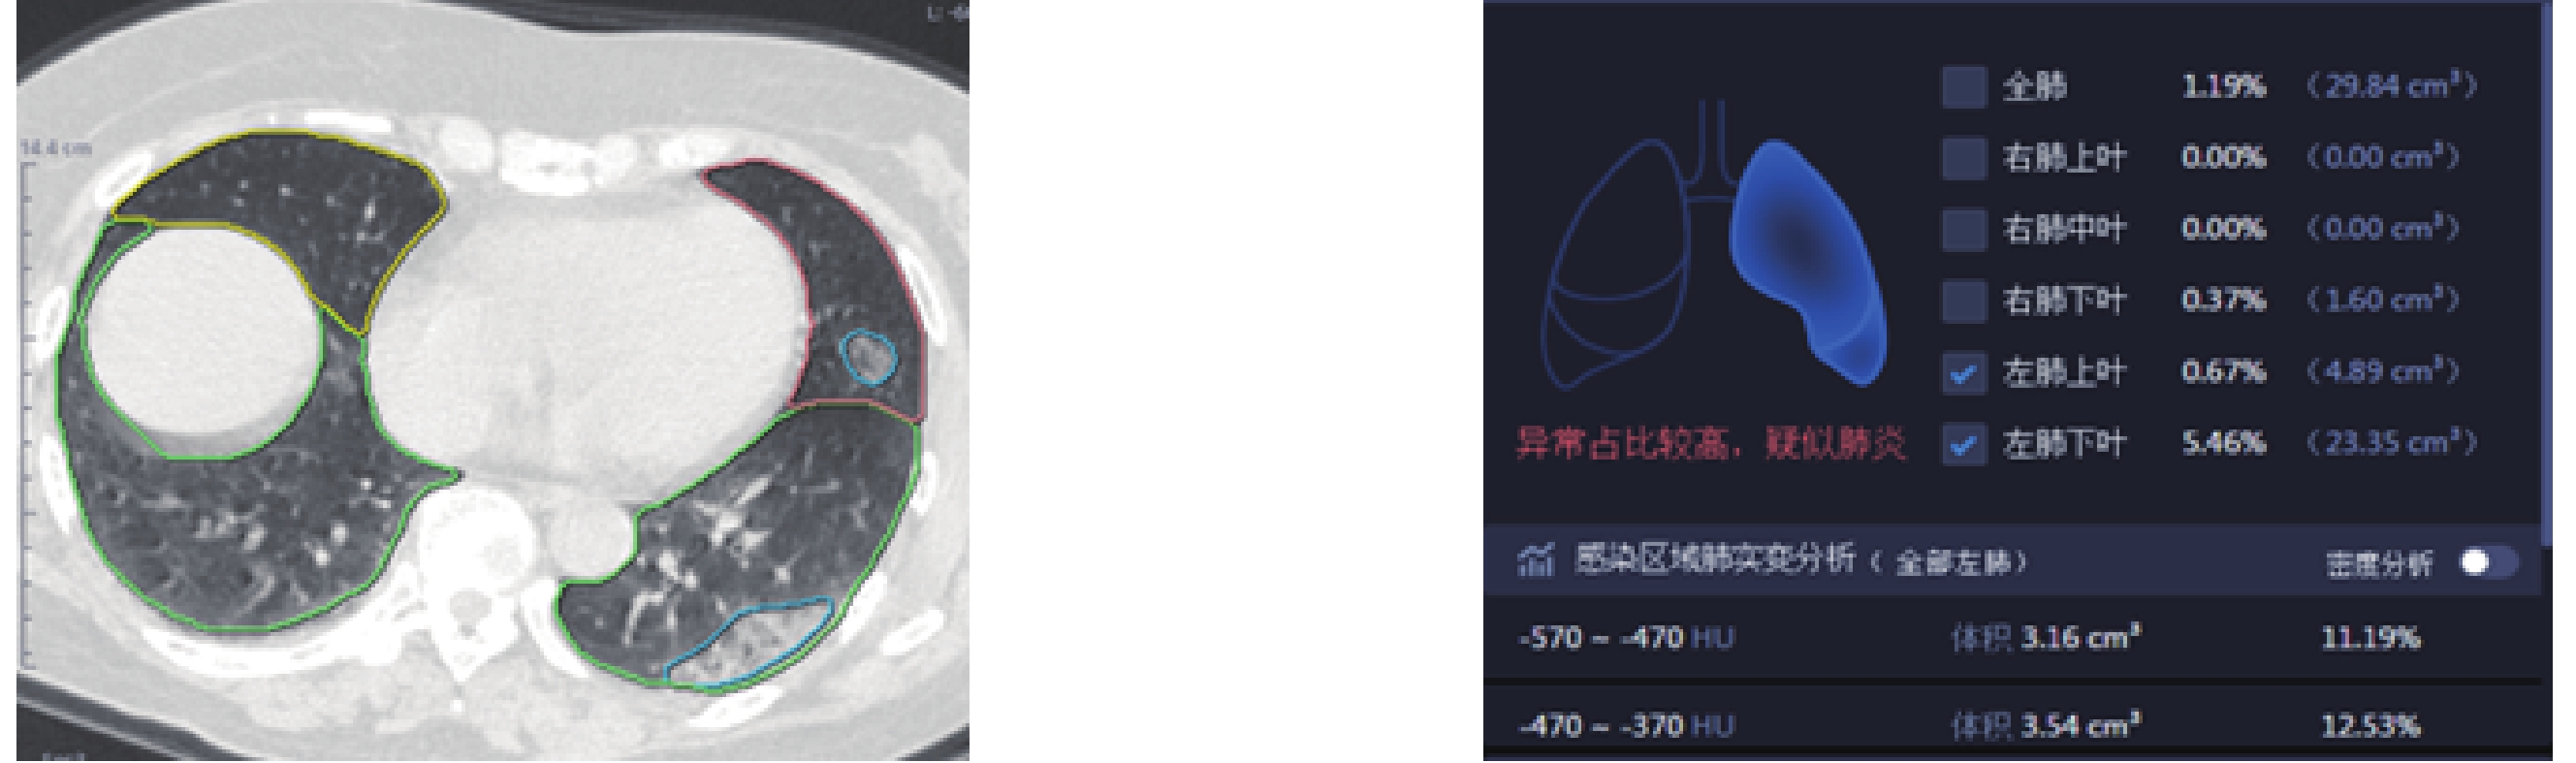
![]()
图 5 46岁女性,Delta组患者,应用肺部感染辅助诊断软件进行处理获取左肺上叶、下叶肺炎病灶体积及体积占比
Figure 5. A 46-year-old female patient in the delta group was treated with pulmonary infection auxiliary diagnostic software to obtain the volume and proportion of pneumonia lesions in the upper and lower lobes of the left lung
表 1 影像学征象比较
Table 1 Comparison of imaging findings
特征 组别 统计检验 Delta组(n=293) Omicron组(n=222) $\chi^2$ P 磨玻璃斑片影 164(56.0) 115(51.8) 0.375 0.879 磨玻璃结节影 132(45.1) 99(45.0) 0.001 0.991 索条 2(0.6) 3(1.4) 0.078# 实变 130(44.4) 104(47.3) 0.427 0.513 铺路石征 47(16.0) 38(17.1) 7.014 0.408 小叶间隔增厚 40(13.6) 34(15.3) 0.533# 增粗血管影 29(9.9) 25(11.4) 0.287 0.592 注:#-采用Fisher确切概率法比较。  下载: 导出CSV
表 2 病灶分布比较
Table 2 Comparison of focal distribution
分布 组别 P Delta组(n=293) Omicron组(n=222) 支气管血管束分布 17(5.8) 41(18.5) 0.029 胸膜下分布 276(94.2) 181(81.5)
下载: 导出CSV
表 3 Delta组与Omicron组肺炎体积及体积占比比较
Table 3 Comparison of pneumonia volume and volume proportion between the delta and omicron groups
指标 组别 统计检验 Delta组(n=293) Omicron组(n=222) Z P 全肺病灶体积占比/% 3.39(0.56~8.78) 1.69(0.44~6.93) 0.917 0.025 全肺病灶体积/cm3 113.93(23.60~320.39) 66.80(15.83~234.35) 2.174 0.030 右肺上叶病灶体积占比/% 0.63(0.00~3.63) 0.40(0.00~2.82) 1.361 0.173 右肺上叶病灶体积/cm3 5.63(0.00~28.83) 3.23(0.00~27.00) 1.325 0.185 右肺中叶病灶体积占比/% 0.84(0.00~6.22) 0.31(0.00~3.475) 2.380 0.017 右肺中叶病灶体积/cm3 3.07(0.00~18.56) 1.30(0.00~10.21) 2.447 0.014 右肺下叶病灶体积占比/% 4.61(0.62~17.34) 2.18(0.24~12.69) 2.940 0.003 右肺下叶病灶体积/cm3 37.68(5.58~117.28) 17.02(1.90~82.04) 2.942 0.003 左肺上叶病灶体积占比/% 0.28(0.00~3.76) 0.36(0.00~3.06) 0.468 0.639 左肺上叶病灶体积/cm3 2.51(0.002~28.70) 3.45(0.00~26.27) 0.548 0.584 左肺下叶病灶体积占比/% 3.27(0.35~14.18) 1.63(0.15~12.67) 1.917 0.055 左肺下叶病灶体积/cm3 23.21(2.45~86.92) 11.49(0.95~69.64) 2.003 0.065
下载: 导出CSV
表 4 不同CT值分段病变体积及体积占比
Table 4 Volume and volume proportion of different CT values
指标 组别 统计检验 Delta组(n=293) Omicron组(n=222) Z P -570~-470体积/cm3 14.66(2.85~44.29) 9.01(2.12~31.59) 1.956 0.050 -570~-470体积占比/% 13.82(11.39~15.86) 13.79(11.16~16.28) 0.337 0.736 -470~-370体积/cm3 12.14(2.15~35.79) 7.65(1.86~25.26) 2.083 0.037 -470~-370体积占比/% 11.31(8.80~13.77) 11.05(8.56~13.28) 0.580 0.562 -370~-270体积/cm3 9.43(1.81~27.9) 6.11(1.34~18.07) 2.336 0.019 -370~-270体积占比/% 9.00(6.24~12.00) 8.44(5.81~10.81) 1.395 0.163 -270~-170体积/cm3 6.74(1.24~22.73) 4.60(0.88~13.49) 2.212 0.027 -270~-170体积占比/% 6.63(4.39~10.00) 6.29(4.17~8.67) 1.248 0.212 -170~-70体积/cm3 4.65(0.97~16.92) 3.17(0.61~10.73) 1.915 0.055 -170~-70体积占比/% 5.03(2.99~8.32) 4.76(2.72~7.36) 0.741 0.458 -70~-30体积/cm3 3.47(0.59~11.89) 2.23(0.43~8.73) 1.634 0.102 -70~-30体积占比/% 3.49(1.60~5.78) 3.25(1.49~6.34) 0.085 0.932 30~70体积/cm3 0.58(0.06~2.85) 0.38(0.03~2.33) 1.636 0.102 30~70体积占比/% 0.67(0.20~1.52) 0.54(0.16~1.39) 0.673 0.501
下载: 导出CSV
-
[1] DAVIES N G, ABBOTT S, BARNARD R C, et al. Estimated transmissibility and impact of SARS-CoV-2 lineage B.1.1.7 in England[J]. Nature Communications, 2021, 372(6538): eabg3055. DOI: 10.1126/science.abg3055.
[2] RAMAN R, PATEL K J, RANJAN K. COVID-19: Unmasking emerging SARS-CoV-2 variants, vaccines and therapeutic strategies[J]. Biomolecules, 2021, 11(7): 993. doi: 10.3390/biom11070993
[3] 张影, 李晓鹤, 陈凤, 等. 新型冠状病毒德尔塔和奥密克戎变异株感染患者的临床特征分析[J]. 新发传染病电子杂志, 2022,7(3): 22−26. DOI: 10.19871/j.cnki.xfcrbzz.2022.03.005. ZHANG Y, LI X H, CHEN F, et al. Clinical characteristics of patients infected with SARS-CoV-2 Delta and Omicron variants[J]. Electronic Journal of Emerging Infectious Diseases, 2022, 7(3): 22−26. DOI: 10.19871/j.cnki.xfcrbzz.2022.03.005. (in Chinese).
[4] RUBIN G D, RYERSON C J, HARAMATI L B, et al. The role of chest imaging in patient management during the COVID-19 pandemic: A multinational consensus statement from the Fleischner Society[J]. Radiology, 2020, 296(1): 172−180. doi: 10.1148/radiol.2020201365
[5] BERNHEIM A, MEI X, HUANG M, et al. Chest CT findings in coronavirus disease-19 (COVID-19): Relationship to duration of infection[J]. Radiology, 2020, 295(3): 685−691.
[6] 车宏伟, 张晓琴, 柴军, 等. 新型冠状病毒肺炎临床表现及CT影像学分析[J]. CT理论与应用研究, 2021,30(4): 525−532. DOI: 10.15953/j.1004-4140.2021.30.04.14. CHE H W, ZHANG X Q, CHAI J, et al. Clinical manifestations and CT imaging analysis of corona virus disease 2019[J]. CT Theory and Applications, 2021, 30(4): 525−532. DOI: 10.15953/j.1004-4140.2021.30.04.14. (in Chinese).
[7] AWULACHEW E, DIRIBA K, ANJA A, et al. Computed tomography (CT) imaging features of patients with COVID-19: Systematic review and meta-analysis[J]. Radiology Research and Practice, 2020: 1023506.
[8] PAN F, YE T, SUN P, et al. Time course of lung changes on chest CT during recovery from 2019 novel coronavirus (COVID-19) pneumonia[J]. Radiology, 2020, 295(3): 715−721.
[9] 胡元楠, 邓明, 胡金香, 等. 多参数定量CT评估新型冠状病毒肺炎预后的价值[J]. 武汉大学学报(医学版), 2021,42(2): 237−241. DOI: 10.14188/j.1671-8852.2020.0296. HU Y N, DENG M, HU J X, et al. Value of multiparameter quantitative CT in evaluating the prognosis of COVID-19[J]. Medical Journal of Wuhan University, 2021, 42(2): 237−241. DOI: 10.14188/j.1671-8852.2020.0296. (in Chinese).
[10] GUAN C S, LV Z B, LI J, et al. CT appearances, patterns of progression, and follow-up of COVID-19: Evaluation on thin-section CT[J]. Insights into Imaging, 2021, 12(1): 73. doi: 10.1186/s13244-021-01019-0
[11] LI B, DENG A, LI K, et al. Viral infection and transmission in a large, well-traced outbreak caused by the SARS-CoV-2 Delta variant[J]. Nature Communications, 2022, 13(1): 460. doi: 10.1038/s41467-022-28089-y
[12] IULIANO A D, BRUNKARD J M, BOEHMER T K, et al. Trends in disease severity and health care utilization during the early Omicron variant period compared with previous SARS-CoV-2 high transmission periods—United States, December 2020–January 2022[J]. Morbidity and Mortality Weekly Report, 2022, 71(4): 146−152. doi: 10.15585/mmwr.mm7104e4
[13] HU T, ZHANG M, DENG A, et al. Comparison of Omicron and Delta variant infection COVID-19 cases—Guangdong Province, China, 2022[J]. China CDC Weekly, 2022, 4(18): 385.
[14] YOON S H, LEE J H, KIM B N. Chest CT findings in hospitalized patients with SARS-CoV-2: Delta versus Omicron variants[J]. Radiology, 2023, 306(1): 252−260. doi: 10.1148/radiol.220676
[15] HUI K P Y, HO J C W, CHEUNG M, et al. SARS-CoV-2 Omicron variant replication in human bronchus and lung ex vivo[J]. Nature, 2022, 603(7902): 715−720. doi: 10.1038/s41586-022-04479-6
[16] ULLOA A C, BUCHAN S A, DANEMAN N, et al. Estimates of SARS-CoV-2 Omicron variant severity in Ontario, Canada[J]. JAMA, 2022, 327(13): 1286−1288. doi: 10.1001/jama.2022.2274
[17] ULLOA A C, BUCHAN S A, DANEMAN N, et al. Early estimates of SARS-CoV-2 Omicron variant severity based on a matched cohort study, Ontario, Canada[J]. MedRxiv, 2021: 2021.12. 24.21268382.
[18] WOLTER N, JASSAT W, WALAZA S, et al. Early assessment of the clinical severity of the SARS-CoV-2 Omicron variant in South Africa: A Data linkage study[J]. The Lancet, 2022, 399(10323): 437−446. doi: 10.1016/S0140-6736(22)00017-4
[19] 龚晓明, 李航, 宋璐, 等. 新型冠状病毒肺炎(COVID-19)CT表现初步探讨[J]. 放射学实践, 2020,35(3): 261−265. DOI: 10.13609/j.cnki.1000-0313.2020.03.003. GONG X M, LI H, SONG L, et al. Preliminary study on CT characteristics of corona virus disease 2019[J]. Radiologic Practice, 2020, 35(3): 261−265. DOI: 10.13609/j.cnki.1000-0313.2020.03.003. (in Chinese).
[20] 张振华, 吉祥, 张劲松, 等. 基于AI技术的新型冠状病毒肺炎CT影像特点分析[J]. 医疗卫生装备, 2020,41(5): 6−8, 27. DOI: 10.19745/j.1003-8868.2020099. ZHANG Z H, JI X, ZHANG J S, et al. Analysis of COVID-19 CT features based on AI technology[J]. Chinese Medical Equipment Journal, 2020, 41(5): 6−8, 27. DOI: 10.19745/j.1003-8868.2020099. (in Chinese).
[21] TSAKOK M T, WATSON R A, SAUJANI S J, et al. Chest CT and hospital outcomes in patients with Omicron compared with Delta variant SARS-CoV-2 infection[J]. Radiology, 2022, 306(1): 261−269. DOI: 10.1148/radiol.220533.


计量
- 文章访问数: 227
- HTML全文浏览量: 74
- PDF下载量: 25


