
Correlation Analysis between Dynamic Changes in Computed Tomography Findings and Clinical Outcomes in Cases Infected with Different Strains of Coronavirus Disease 2019
-
摘要: 目的:分析、对比新型冠状病毒感染不同毒株胸部CT表现及其演变特点,探讨其与临床转归的相关性。方法:收集、整理内蒙古自治区75例原始株、130例德尔塔(Delta)变异株和562例奥密克戎(Omicron)变异株病例的胸部CT图像,分析、对比不同毒株CT表现及变化规律。结果:Omicron组中的轻型患者比例(499例,88.79%)明显多于原始株组(9例,12.00%)和Delta组(47例,36.15%)。相对于原始株组,Delta组轻型患者发生率较高(47例,36.15% vs.9例,12.00%),重症发生率较低(14例,16.87% vs.19例,28.79%)。96.97%(64例)原始株组病例,93.98%(78例)Delta组病例,98.41%(62例)Omicron组病例初次CT表现以磨玻璃影为主,3组间无统计学差异。在磨玻璃影形态和分布方面,19.05%(12例)Omicron组病例表现为腺泡结节磨玻璃影,明显多于原始株组(3.03%,2例)及Delta组(3.61%,3例),3组病例病灶主要沿胸膜下分布,但Omicron组较原始株组及Delta组沿支气管血管束周围分布比例更高。在伴随征象方面,初次CT中伴随实变和条索比例较低,原始株组、Delta组及Omicron组病例伴随实变比例分别为3.03%(2例),6.02%(5例)和5.00%(1例);伴随条索比例分别为12.12%(8例),15.66%(13例)和20.00%(4例)。原始株组和Delta组病程中病灶影像学表现会出现变化,原始株组39.39%(26例)病例在原磨玻璃影基础上出现实变,53.03%(35例)病例在原磨玻璃影基础上出现条索,明显高于初次CT实变和条索比例;Delta组44.58%(37例)病例在原磨玻璃影基础上出现实变,61.45%(51例)病例在原磨玻璃影基础上出现条索;Omicron组34.38%(11例)病例在原磨玻璃影基础上出现实变,71.88%(23例)病例在原磨玻璃影基础上出现条索,二者同样明显高于初次CT实变和条索比例。原始株组、Delta组和Omicron组病例病灶明显吸收距发病时间中位天数分别为16、16和9 d。结论:新型冠状病毒感染不同毒株胸部CT表现的动态变化,可以反映病变随临床病程的演变规律,对新型冠状病毒感染病程判定和疾病管理具有临床应用价值。Abstract: Objective: To analyze and compare chest computed tomography (CT) findings and evolutionary characteristics of different strains of novel corona virus pneumonia and to explore the correlation of CT findings and strain characteristics with clinical outcomes. Methods: Chest CT images of 75 cases of the original strain, 130 cases of the Delta variant, and 562 cases of the Omicron variant from the Inner Mongolia Autonomous Region, were collected and sorted. The CT manifestations and their changes for different strains were analyzed and compared. Results: The proportion of patients with mild disease in the Omicron variant group (499 cases, 88.79%) was significantly higher than that in the original strain (9 cases, 12.00%) and Delta variant groups (47 cases, 36.15%). Compared to the original strain group, the Delta variant group showed higher incidences of mild cases% (47 cases, 36.15% vs. 9 cases, 12.00%) and lower incidences of severe cases (14 cases, 16.87% vs. 19 cases, 28.79%). A total of 96.97% (64 cases) of the original strain group, 93.98% (78 cases) of the Delta variant group, and 98.41% (62 cases) of the Omicron variant group showed ground-glass opacities, which were the main manifestations on the first CT scan. There was no statistically significant difference among the three groups. In terms of morphology and distribution of ground-glass opacity, 12 cases (19.05%) of the Omicron group showed acinular nodule ground-glass opacity, which was significantly higher than that shown by the original strain group (2 cases, 3.03%) and the Delta variant group (3 cases, 3.61%). The lesions in the three groups were mainly distributed along the subpleural lung regions. However, the Omicron variant group had a higher distribution ratio along the bronchial vascular bundle than the original strain and Delta variant groups. In terms of concomitant signs, concomitant consolidation and cable proportion were significantly lower on the first CT image. The proportions of concurrent consolidation in the original strain, Delta variant, and Omicron variant groups were 3.03% (2 cases), 6.02% (5 cases), and 5.00% (1 case), respectively. The proportions of accompanying cables in the original strain, Delta variant, and Omicron variant groups were 12.12% (8 cases), 15.66% (13 cases), and 20.00% (4 cases), respectively. The imaging findings of the lesions in the original strain and Delta variant groups changed over the course of the disease. In the original strain group, 39.39% (26 cases) had realistic changes based on the original ground-glass opacity and 53.03% (35 cases) had a cord based on the original ground-glass opacity. This proportion was significantly higher than the proportion of consolidation and cord based on the first CT. In the Delta variant group, 44.58% (37 cases) of patients showed inflammatory consolidation based on the original ground-glass opacity and 61.45% (51 cases) of patients showed a cord based on the original ground-glass opacity. In the Omicron variant group, 34.38% (11 cases) had inflammatory consolidation based on the original ground-glass opacity and 71.88% (23 cases) had cord based on the original ground-glass opacity, both of which were significantly higher than the proportions of primary inflammatory consolidation and cord. The median number of days from apparent absorption to onset in the original strain, Delta variant and Omicron variant groups were 16 days, 16 days, and 9 days, respectively. Conclusions: The dynamic changes in chest CT findings of cases infected with different strains of COVID-19 can reflect the evolution of lesions with the clinical course of the disease. This prediction has clinical application value in determining the course of COVID-19 and disease management.
-
Keywords:
- computed tomography /
- coronavirus disease 2019 /
- Delta /
- Omicron /
- dynamic changes
-
-
![]()
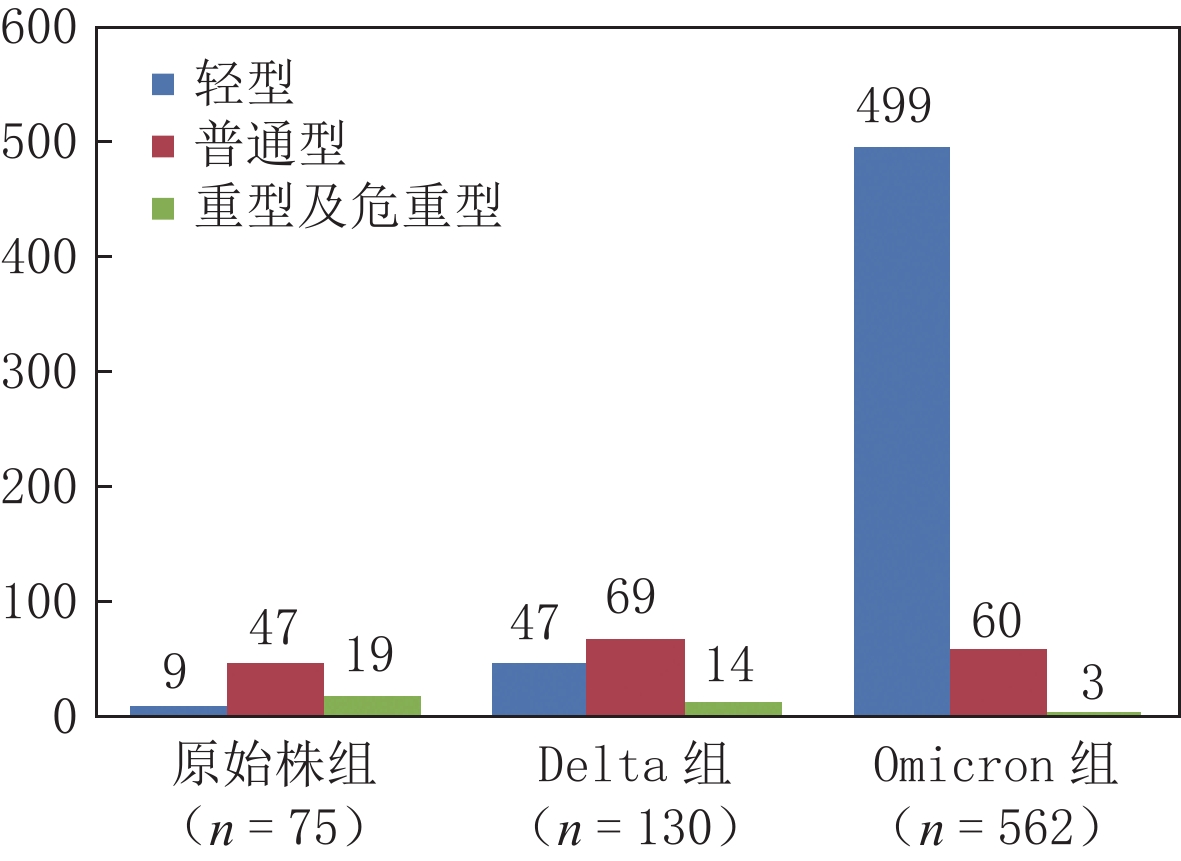
图 1 不同毒株临床分型分布图
Figure 1. Clinical distribution of cases infected with different strains of COVID-19
![]()
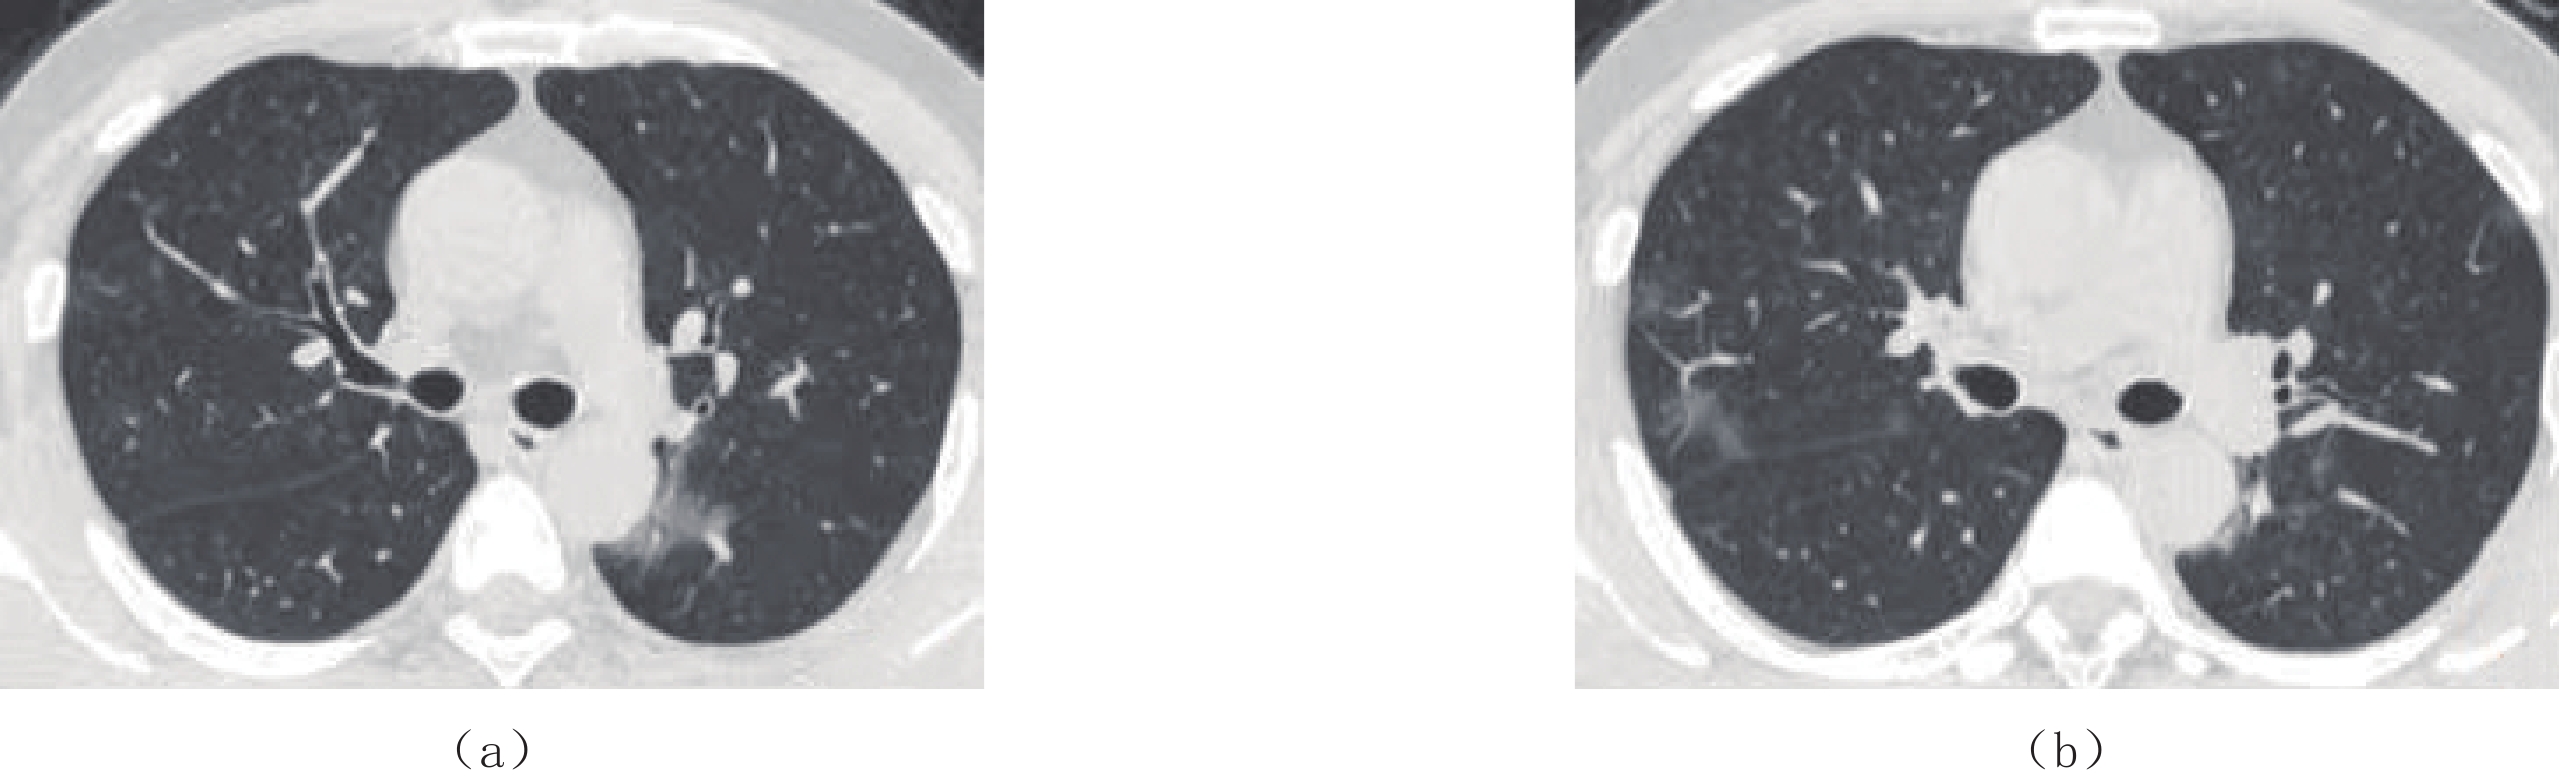
图 2 男,47岁,Omicron组,咽痛、发热2天,新型冠状病毒感染核酸检测阳性1天
(a)(b)左肺下叶背段及右肺上叶多发磨玻璃影,胸膜下分布。
Figure 2. A computed tomography image of a 47-year-old male from the Omicron variant group. The patient had pharyngeal pain and fever for 2 days. The nucleic acid test of novel coronavirus pneumonia was positive for a day
![]()
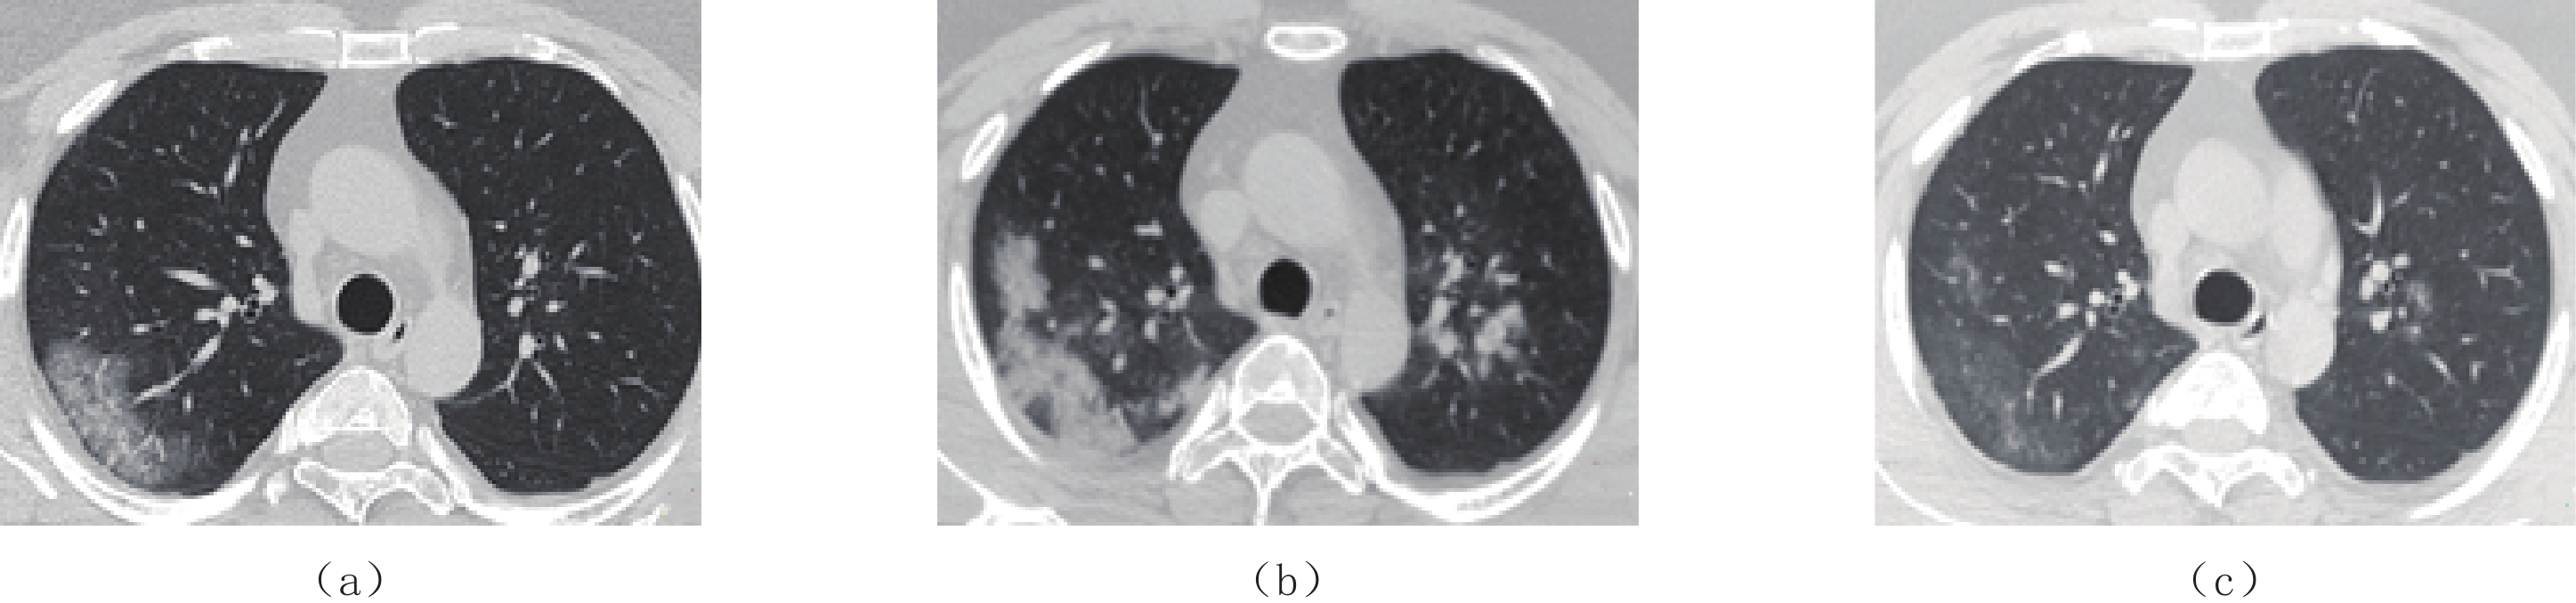
图 4 男,39岁,原始株组患者,临床诊断为新型冠状病毒感染普通型
(a)发病第3天初次CT示右肺上叶胸膜下磨玻璃影,伴支气管充气征及血管增粗。(b)发病第8天后复查CT,病灶范围增大,且密度增高,呈实变表现,另可见双肺上叶新出现病灶。(c)发病13天后复查,病灶基本完全吸收,仅残留少量磨玻璃影,密度较淡,边缘模糊。
Figure 4. A computed tomography image of a 39-year-old male from the original strain group, which is clinically diagnosed as common COVID-19
![]()
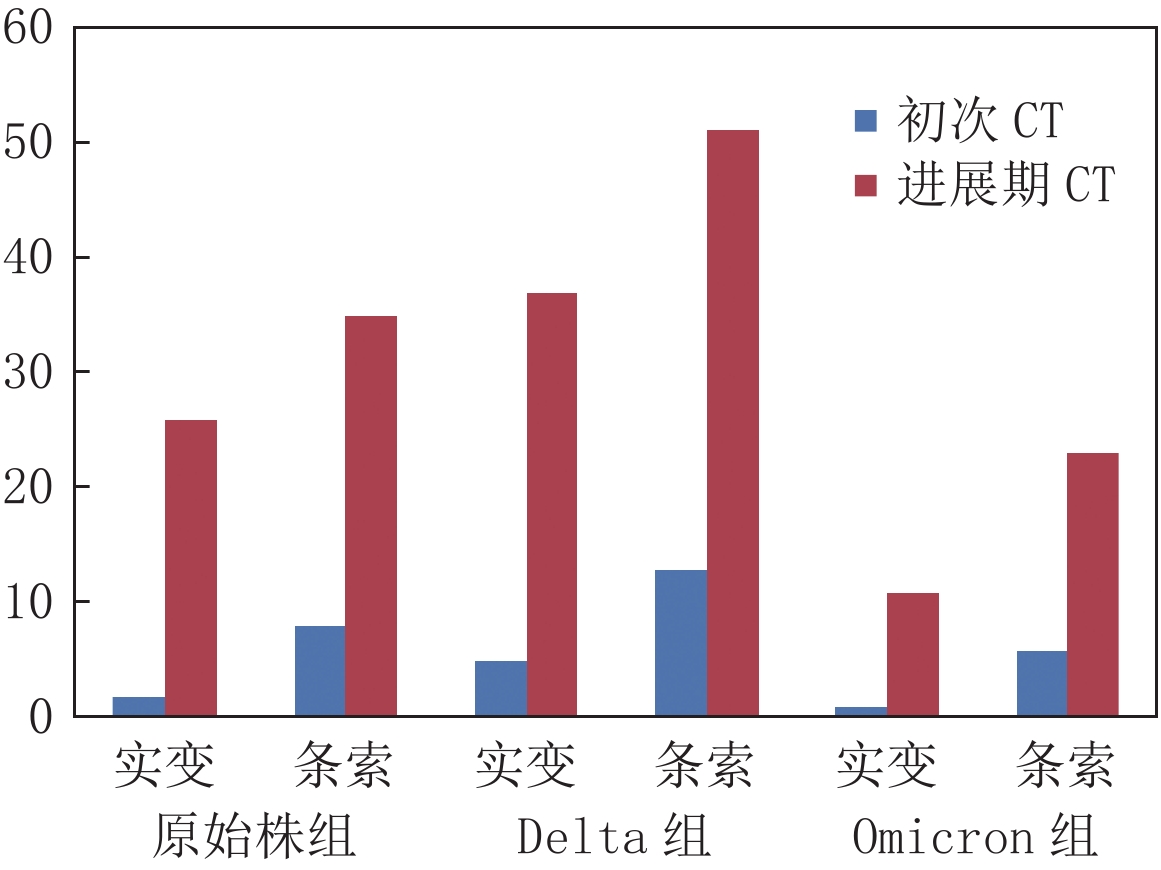
图 3 不同毒株患者病程中实变影和条索影变化
Figure 3. Changes of consolidation and cord in patients infected with different strains of COVID-19, during the course of the disease
![]()
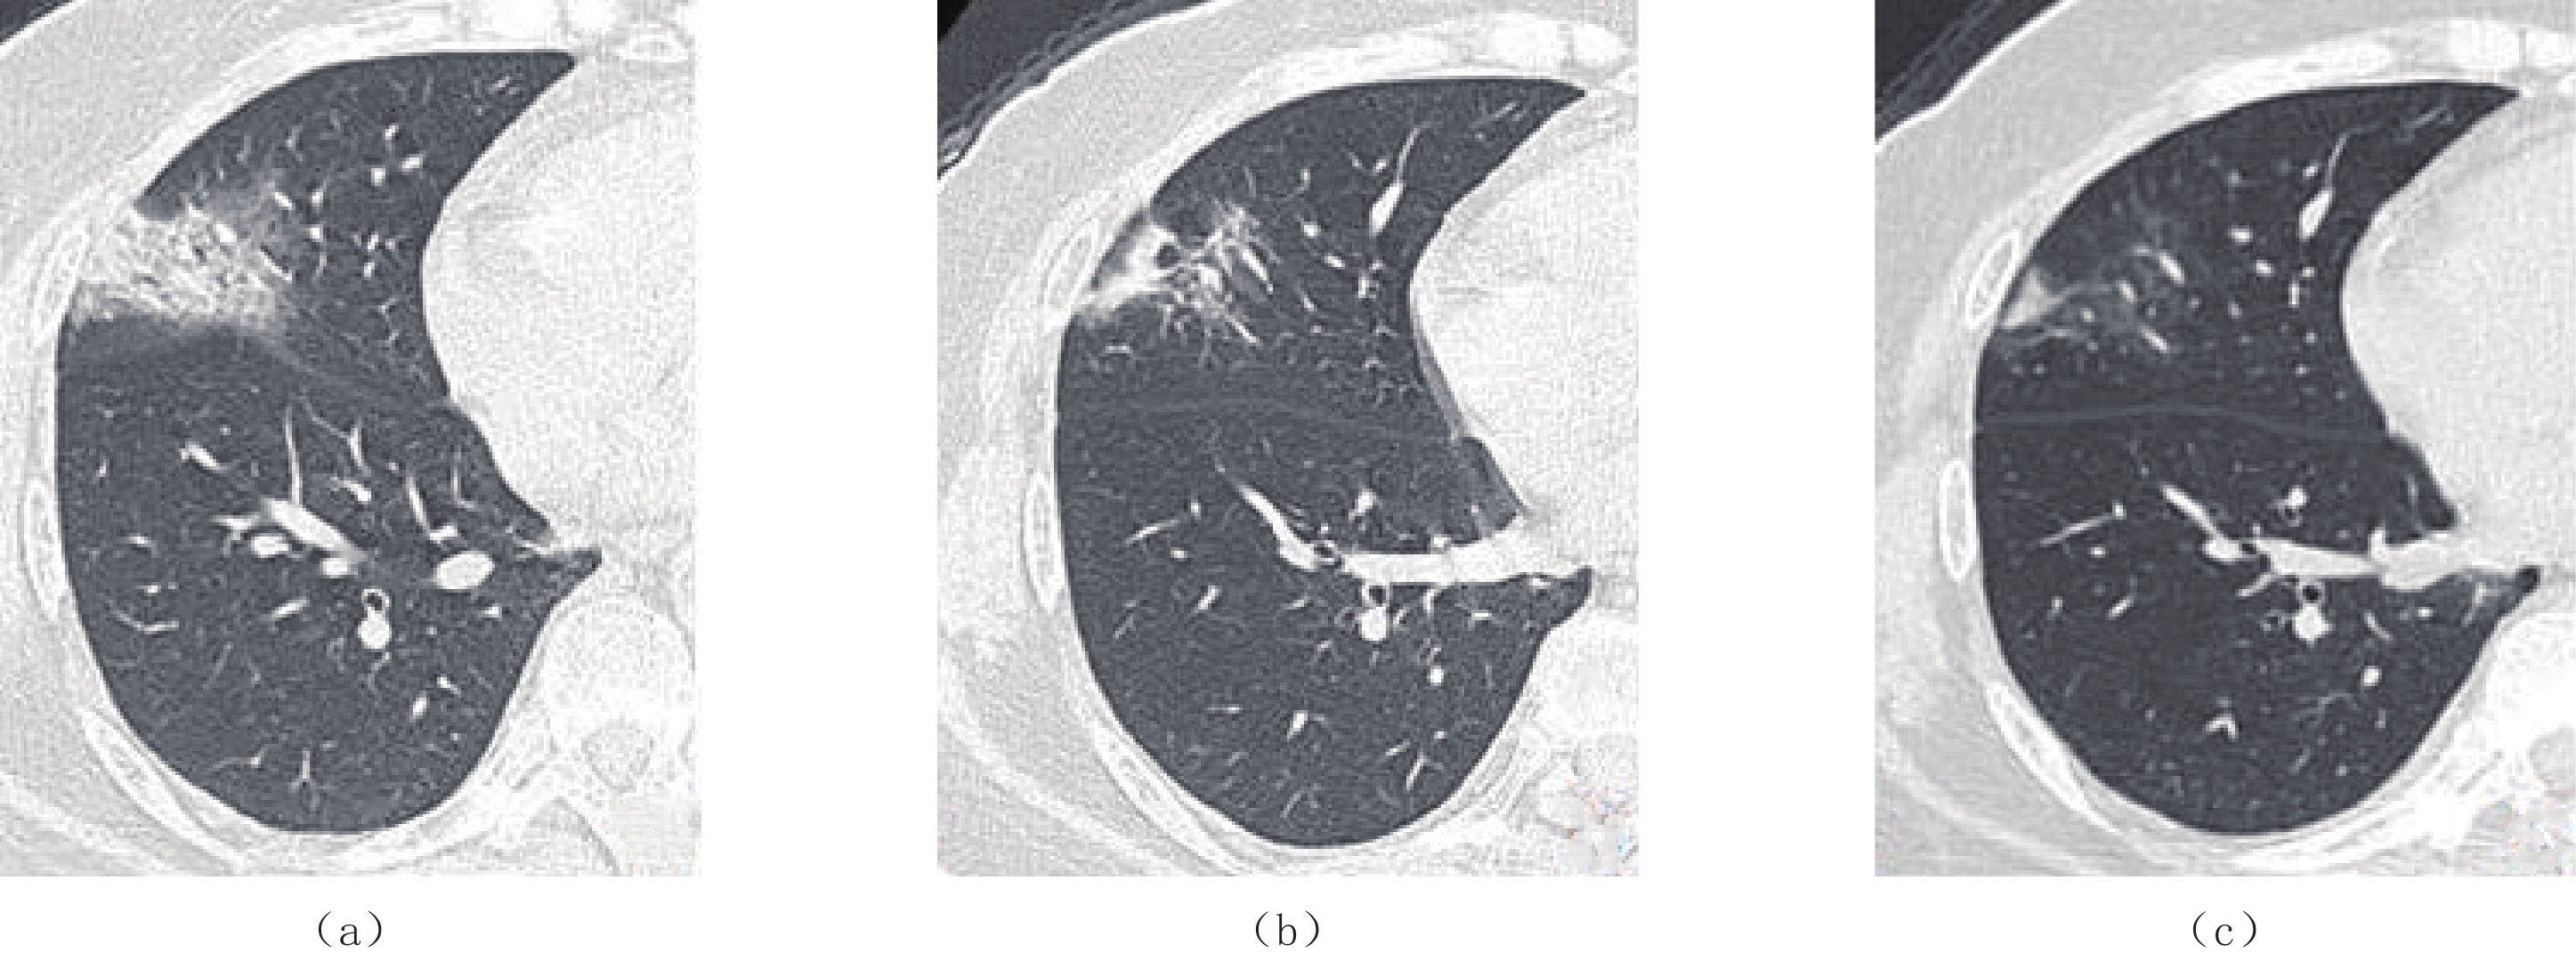
图 5 女,45岁,Delta组,临床诊断为新型冠状病毒感染普通型
(a)发病第3天初次CT示右肺中叶磨玻璃影,伴铺路石征及支气管充气征。(b)发病第10天复查CT示磨玻璃病灶变化快,明显吸收,密度减低,并出现条索影。(c)发病第17天复查,病灶基本完全吸收,残留少量条索及密度较淡、边缘模糊的小片磨玻璃影。
Figure 5. A computed tomography image of a 45-year-old female from the Delta variant group, which is clinically diagnosed as common COVID-19
![]()
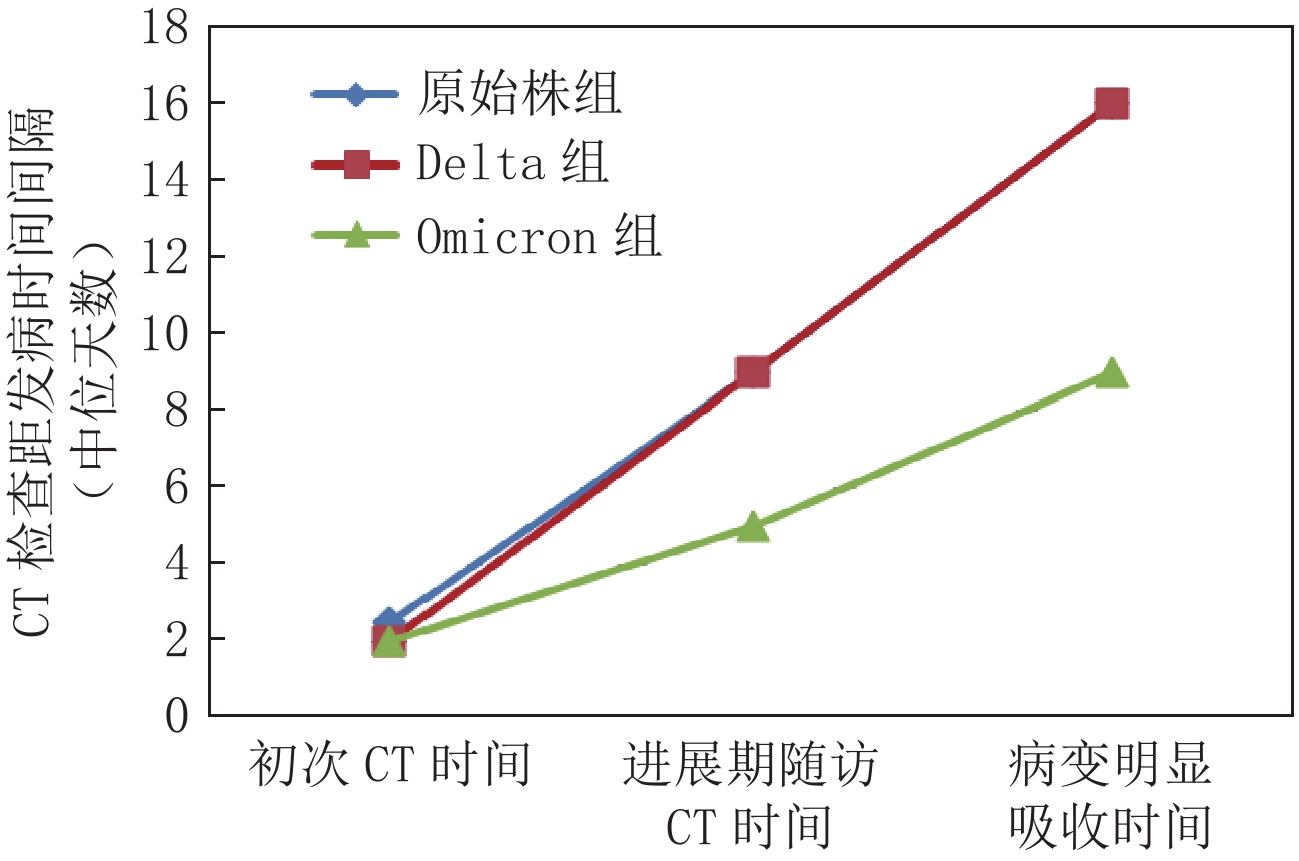
图 6 不同毒株患者病程中CT检查间隔时间比较
Figure 6. Comparison of computed tomography intervals in the course of disease with different strains of COVID-19
表 1 新型冠状病毒感染不同毒株肺炎发生情况
Table 1 Incidence of pneumonia in cases infected with different strains of COVID-19
罹患肺炎情况 合计 发生情况 统计检验 发生 未发生 $\chi^2$ P 原始株组a、b 75 66 9 297.682 0.000 Delta组c 130 83 47 Omicron组 562 63 499 注:a-原始株组与Delta组发生率比较有统计学意义,P<0.05校正值;b-原始株组与Omicron组发生率比较有统计学意义,P<0.05校正值;c-Delta组与Omicron组发生率比较有统计学意义,P<0.05校正值。  下载: 导出CSV
表 2 新型冠状病毒感染不同毒株临床分型情况
Table 2 Clinical classification of cases infected with different strains of COVID-19
组别 分型 统计检验 轻型 普通型 重型及危重型 $\chi^2$ P 原始株组 9 47 19 321.168 0.000 Delta组 47 69 14 Omicron组a 499 60 3 注:a-Omicron组与原始株组、Delta组在临床分型比较均有统计学意义,P<0.05校正值。
下载: 导出CSV
表 3 新型冠状病毒感染不同毒株患者初次CT病变分布情况
Table 3 Distribution of primary computed tomography lesions in patients infected with different strains of COVID-19
病变分布 组别 统计检验 原始株组(n=66) Delta组(n=83) Omicron组(n=63) $\chi^2$ P 累计范围 单肺 13 20 23 5.064 0.08 双肺 53 63 40 累计肺叶数量b 1 12 15 18
250.770
0.0002 10 19 27 3 11 14 15 4 9 13 2 5 24 22 1 病灶分布 胸膜下 40 55 30
45.760
0.000胸膜下伴支气
管血管束周围26 24 11 支气管血管
束周围a0 4 22 注:a-Omicron组与原始株组、Delta组比较均有统计学意义,P<0.05校正值;b-原始株组、Delta组、Omicron组两两比较均有统计学意义,P<0.05校正值。
下载: 导出CSV
表 4 初次CT影像学表现
Table 4 Primary computed tomography imaging findings
CT表现 组别 统计检验 原始株组(n=66) Delta组(n=83) Omicron组(n=63) $\chi^2/F$ P 斑片状磨玻璃影a 62 75 50 7.190 0.027 腺泡结节磨玻璃影a 2 3 12 14.799 0.001 实变 2 5 1 2.087 0.352 铺路石征b 32 43 15 12.919 0.002 支气管充气征 19 25 21 0.332 0.847 条索 8 13 6 1.247 0.536 血管增粗 27 33 19 1.957 0.376 胸腔积液 3 2 1 1.113 0.573 注:a-Omicron组与原始株组、Delta组比较均有统计学意义,P<0.05校正值;b-原始株组与Delta组、Omicron组比较有统计学意义,P<0.05校正值。
下载: 导出CSV
表 5 不同毒株进展期磨玻璃影变化特点
Table 5 Change characteristics of ground-glass opacity in advanced stage of COVID-19 infection with different strains
CT变化 组别 统计检验 原始株组(n=66) Delta组(n=83) Omicron组(n=32) $\chi^2$ P 病灶变化 无变化 8 7 4 0.967 0.915 吸收 43 56 22 进展 15 20 6 原病变中是否出现实变 26 37 11 1.090 0.580 原病变中是否出现条索 35 51 23 3.291 0.193 是否新出现胸腔积液 3 4 1 0.161 0.923
下载: 导出CSV
表 6 不同毒株患者病程中CT检查时间间隔
$({{{M}}}({P}_{25},{P}_{75}))$ Table 6 Time interval of computed tomography examinations in the course of disease with different strains of COVID-19
$({M}({P}_{25}, {P}_{75}))$ CT检查时间间隔/d 初次CT时间 进展期随访CT时间 病变明显吸收时间 原始株组(n=66)a、b 2.5(2~4) 9(8~11) 16(12.75~22.25) Delta组(n=83)c 2(1~2) 9(8~10) 16(14~17) Omicron组(n=32) 2(1~2) 5(4.25~6) 9(8~10) $\chi^2$ 21.037 70.906 61.210 P 0.000 0.000 0.000 注:a-原始株组与Omicron组在初次CT时间、进展期随访CT时间、病变明显吸收时间比较均有统计学意义,P<0.05校正值;b-原始株组与Delta组组在初次CT时间、进展期随访CT时间比较均有统计学意义,P<0.05校正值;c-Delta组与Omicron组在进展期随访CT时间、病变明显吸收时间上比较均有统计学意义,P<0.05校正值。
下载: 导出CSV
-
[1] World Health Organization. Tracking SARS-CoV-2 variants[EB/OL]. (2021-12-06)[2021-12-09]. https://www.who.int/en/activities/tracking-SARS-CoV-2-variants/.
[2] RAMAN R, PATEL K J, RANJAN K. COVID-19: Unmasking emerging SARS-CoV-2 variants, vaccines and therapeutic strategies[J]. Biomolecules, 2021, 11(7): 993. doi: 10.3390/biom11070993
[3] 张影, 李晓鹤, 陈凤, 等. 新型冠状病毒德尔塔和奥密克戎变异株感染患者的临床特征分析[J]. 新发传染病电子杂志, 2022,7(3): 22−26. DOI: 10.19871/j.cnki.xfcrbzz.2022.03.005. ZHANG Y, LI X H, CHEN F, et al. Clinical characteristics of patients infected with SARS-CoV-2 Delta and Omicron variants[J]. Electronic Journal of Emerging Infectious Diseases, 2022, 7(3): 22−26. DOI: 10.19871/j.cnki.xfcrbzz.2022.03.005. (in Chinese).
[4] ARAF Y, AKTER F, TANG Y D, et al. Omicron variant of SARS-CoV-2: Genomics, transmissibility, and responses to current COVID-19 vaccines[J]. Journal of Medical Virology, 2022, 94(5): 1825−1832. doi: 10.1002/jmv.27588
[5] GUAN C S, LV Z B, LI J J, et al. CT appearances, patterns of progression, and follow-up of COVID-19: Evaluation on thin-section CT[J]. Insights into Imaging, 2021, 12: 73. doi: 10.1186/s13244-021-01019-0
[6] 国家卫生健康委员会. 《新型冠状病毒感染的肺炎诊疗方案》试行(第九版)[EB/OL]. [2022-03-15]. http://www.nhc.gov.cn/xcs/zhengcwj/. [7] HANSELL D M, BANKIER A A, MACMAHON H, et al. Fleischner society: Glossary of terms for thoracic imaging[J]. Radiology, 2008, 246(3): 697−722. DOI: 10.1148/radiol.2462070712.
[8] FANG Y C, ZHANG H Q, XIE J C, et al. Sensitivity of chest CT for COVID-19: Comparison to RT-PCR[J]. Radiology, 2020, (2): 200432−7.
[9] 中华医学会放射学分会传染病学组, 中国医师协会放射医师分会感染影像专委会, 中国研究型医院学会感染与炎症放射专委会, 等. 新型冠状病毒感染的肺炎影像学诊断指南(2020 第二版)[J]. 首都医科大学学报, 2020,41(2): 168−173. doi: 10.3969/j.issn.1006-7795.2020.02.004 Committee of the Infectious Diseases Radiology Group of Chinese Society of Radiology, Committee of the Infectious Diseases Radiology Section of Chinese Medical Doctor Association, Infectious Disease Imaging Group, Infectious Disease Branch, Chinese Research Hospital Association, et al. Guideline for imaging diagnosis of novel corona virus (2019-nCoV) infected pneumonia (2st edition 2020)[J]. Journal of Capital Medical University, 2020, 41(2): 168−173. (in Chinese). doi: 10.3969/j.issn.1006-7795.2020.02.004
[10] FENG Z C, YU Q Z, Y S H, et al. Early prediction of disease progression in 2019 novel corona virus pneumonia patients out-side wuhan with CT and clinical characteristics[EB/OL]. ( 2020-02-23). https://www.medrxiv.Org/content/10.1101/2020.02.19.20025296v1.
[11] 黄璐, 韩瑞, 于朋鑫, 等. 新型冠状病毒肺炎不同临床分型间CT和临床表现的相关性研究[J]. 中华放射学杂志, 2020,54: 1005−201. [12] HUANG C, WANG Y, LI X, et al. Clinical features of patients infected with 2019 novel corona virus in Wuhan, China[J]. Lancet, 2020, (20): 30183−5.
[13] 刘茜, 王荣帅, 屈国强, 等. 新型冠状病毒肺炎死亡尸体系统解剖大体观察报告[J]. 法医学杂志, 2020,36(1): 21−23. doi: 10.12116/j.issn.1004-5619.2020.01.005 [14] NG M Y, LEE E Y P, YANNG J, et al. Imaging profile of the COVID-19 infection: Radiologic findings and literature review[J]. Radiology, 2020, 2(1): 1−9.
[15] 车宏伟, 张晓琴, 柴军, 等. 新型冠状病毒肺炎临床表现及CT影像学分析[J]. CT理论与应用研究, 2021,30(4): 525−532. DOI: 10.15953/j.1004-4140.2021.30.04.14. CHE H W, ZHANG X Q, CHAI J, et al. Clinical manifestations and CT imaging analysis of corona virus disease 2019[J]. CT Theory and Applications, 2021, 30(4): 525−532. DOI: 10.15953/j.1004-4140.2021.30.04.14. (in Chinese).
[16] PAN F, YE T, SUN P, et al. Time course of lung changes at chest CT during recovery from corona virus disease 2019 (COVID-19)[J]. Radiology, 2020, 295(3): 715−721. doi: 10.1148/radiol.2020200370
[17] KANNE J P. Chest CT findings in 2019 novel corona virus (2019-nCoV) infections from Wuhan, China: Key points for the radiologist[J]. Radiology, 2020, 295(1): 16−17. doi: 10.1148/radiol.2020200241
[18] 向颖, 杨全新, 孙泓泓, 等. 新型冠状病毒肺炎患者胸部CT表现及动态演变[J]. 南方医科大学学报, 2020,40(3): 327−332. XIANG Y, YANG Q X, SUN H H, et al. Chest CT findings and their dynamic changes in patients with COVID-19[J]. Journal Southern Medical University, 2020, 40(3): 327−332. (in Chinese).
[19] YU M, LIU Y, XU D, et al. Prediction of the development of pulmonary fibrosis using serial thin-section CT and clinical features in patients discharged after treatment for COVID-19 pneumonia[J]. Korean Journal of Radiology, 2020, 21(6): 746−755.
[20] 李秀梅, 刘伟, 常然, 等. 新型冠状病毒肺炎影像演变规律及肺纤维化危险因素[J]. 中国医学影像学杂志, 2022,30(1): 29−34. LI X M, LIU W, CHANG R, et al. Patterns of pulmonary image evolution and the risk factors of pulmonary fibrosis in patients with COVID-19[J]. Chinese Journal of Medical Imaging, 2022, 30(1): 29−34. (in Chinese).

计量
- 文章访问数: 193
- HTML全文浏览量: 90
- PDF下载量: 12


