
Analysis of Influencing Factors on Pulmonary Nodule Detection by Computed Tomography with Artificial Intelligence: A Phantom Study
-
摘要:
目的:基于胸部仿真体模实验,对人工智能(AI)诊断系统CT肺结节检出的影响因素进行分析。方法:使用东芝Aquilion CXL 64排CT,设定不同扫描参数(扫描剂量、重建算法及重建层厚)和非扫描参数(结节的大小、密度及胸部位置),对体模扫描并图像重建,运用AI诊断系统检出肺结节。结果:①不同剂量扫描时,肺结节检出真阳性率无统计学差异,低剂量模式时检出假阳性数较高。②3种迭代重建算法比较,检出的肺结节真阳性率无统计学差异,Strong组的真阳性率及假阳性数均较高。③薄层图像的肺结节检出真阳性率明显高于厚层图像。④纵隔旁肺结节真阳性率明显高于胸膜下和肺实质。⑤直径≥8 mm组肺结节检出真阳性率明显高于直径≤5 mm组。⑥3种密度肺结节检出时,真阳性率均无明显差异。结论:CT扫描因素(扫描剂量、重建算法及重建层厚)和非扫描因素(结节的大小、密度及胸部位置)可影响AI肺结节的检出。
Abstract:Objective: This study aimed to analyze the factors influencing artificial intelligence (AI) diagnostic system detection of pulmonary nodules on computed tomography (CT) scans, using a chest simulation phantom experiment with simulated lung nodules. Methods: A Toshiba (Canon) 64-slice spiral CT scanner was used. The phantom was scanned and images were reconstructed under varying scanning parameters (dose, reconstruction algorithm, and layer thickness) and non-scanning parameters (nodule size, density, and chest location). Subsequently, the AI diagnostic system performed pulmonary nodule detection on the images. Results: (1) No statistically significant difference was observed in the true positive rate of pulmonary nodules detected at different scanning doses. However, the low-dose mode produced a higher number of false positives. (2) Comparisons across the three iterative reconstruction algorithms revealed no statistically significant difference in the true positive rate of detected pulmonary nodules. However, the Strong group exhibited a higher true positive rate and a higher number of false positives. (3) The true positive rate of lung nodules detected in thin images was significantly higher than in thick images. (4) The true positive rate of pulmonary nodules located in the paramediastinum was significantly higher in the subpleural and lung parenchyma. (5) The true positive rate of nodules ≥8 mm was significantly higher than that of nodules ≤5 mm. (6) No statistically significant difference was observed in the true positive rate when detecting nodules with differing densities. Conclusion: Both CT scanning parameters (dose, reconstruction algorithm, and layer thickness) and non-scanning parameters (nodule size, density, and chest location) can influence the detection of pulmonary nodules by AI systems.
-
Keywords:
- artificial intelligence /
- X-ray computed tomography /
- pulmonary nodules /
- phantom
-
急性肺栓塞(pulmonary embolism,PE)具有较高的发病率及病死率,是常见的三大致死性心血管疾病之一。CT肺动脉成像(computed tomography pulmonary arteriography,CTPA)是确诊PE影像学检查的首选方法[1],具有很高的敏感性和特异性。64排以上CT扫描速度快,CTPA的数据采集时间都可以控制在3 s以内,准确把握肺动脉增强峰值时间是检查成功的关键。CTPA扫描延迟时间的选择目前常用的方法有小剂量团注测试技术和对比剂团注跟踪技术,小剂量团注测试技术操作步骤多,受操作者个人经验影响较大,对比剂团注跟踪技术受限于机器的过渡延迟时间(即ROI到达阈值切换到正式扫描之间的时间),易导致肺静脉过度强化影响肺动脉的观察。
本研究在两种技术的基础上,通过改良对比剂注射方案,即两段式对比剂同速注射的方法,探讨一种获得优质CTPA成像效果的扫描技术。
1. 材料与方法
1.1 资料与分组
本研究通过首都医科大学附属北京同仁医院伦理委员会的批准(TREC2022-KY037)。收集2022年7月至12月在首都医科大学附属北京同仁医院因怀疑肺栓塞行肺动脉CT增强检查的30例患者作为试验组,其中男17例、女13例,年龄31~87岁,平均(64±16)岁,体重53~84 kg,平均(66.0±8.9)kg,身体质量指数(body mass index,BMI)为(24.03±2.61)kg/m2,增强扫描时采用两段式对比剂同速注射结合团注跟踪技术的方法。
收集2021年1月至2021年12月间30例患者为对照组,男16例、女14例,年龄34~85岁,平均(61±14)岁,体重50~85 kg,平均(65.0±10.5)kg,BMI为(23.51±2.56)kg/m2,采用小剂量团注测试技术的方法。
排除标准:肝肾功能不全及严重心功能不全;既往碘对比剂过敏者,妊娠、甲状腺亢进、癫痫及严重哮喘患者;图像中存在金属、呼吸运动等伪影明显影响诊断;体重大于85 kg的患者未纳入本研究。
1.2 检查方法及扫描参数
使用Philips IQon双层探测器光谱CT机和拜耳双筒高压注射器(StellantD-CE超级版),对比剂为碘普罗胺注射液(拜耳医药保健有限公司),碘浓度370 mg/mL。患者仰卧于CT扫描床上,双手上举,放于头部上方,根据患者情况选择左则或右侧肘静脉注射对比剂。
试验组患者的监测兴趣区(region of interest,ROI)置于肺动脉主干,设定阈值为100 HU。对比剂和生理盐水注射顺序:①经 A注射筒注射对比剂10 mL;②经 B筒注射生理盐水30 mL;③经 A筒注射对比剂20 mL;④经 B筒注射生理盐水30 mL。上述注射步骤均按设定顺序由高压注射器自动无间隔完成,对比剂和生理盐水注射流率均为5 mL/s。在开始注射第1段对比剂时同时跟踪肺动脉主干CT值,达到设定阈值后延迟10 s开始扫描(图1)。
![]() 图 1 两段式对比剂注射方法,注射流率均为5 mL/s,两段对比剂开始注射时间间隔8 s,第1段对比剂达到设定阈值后10 s相当于第2段对比剂达到阈值后2 sFigure 1. In the two-stage injection method, the injection flow rate was 5 mL/s, and the interval between the start of the two-stage contrast injection was 8 s; 10 s after the first stage of contrast reaches the set threshold is equivalent to 2 s after the second stage of contrast reaches the threshold
图 1 两段式对比剂注射方法,注射流率均为5 mL/s,两段对比剂开始注射时间间隔8 s,第1段对比剂达到设定阈值后10 s相当于第2段对比剂达到阈值后2 sFigure 1. In the two-stage injection method, the injection flow rate was 5 mL/s, and the interval between the start of the two-stage contrast injection was 8 s; 10 s after the first stage of contrast reaches the set threshold is equivalent to 2 s after the second stage of contrast reaches the threshold对照组患者使用小剂量团注测试技术。监测ROI同样置于肺动脉主干,注射流率5 mL/s,先经A筒注射对比剂10 mL,再经B筒注射生理盐水30 mL,注射开始同时不间断同层连续扫描,每1.5 s扫描1次,共扫描15次,获得肺动脉主干ROI的时间-密度曲线,测量增强峰值时间,本研究中测得的肺动脉主干对比剂达峰时间为7~13 s,平均(10.8±0.8)s。以此达峰时间+1 s作为延迟时间,然后经A筒注射20 mL对比剂,经B筒注射30 mL生理盐水,以此延迟时间进行扫描。
CTPA扫描参数:使用螺旋扫描方式,管电压120 kV,旋转时间0.27 s,使用Philips IQon CT自带管电流自动调制技术(DoseRight),DoseRight Index选择22;参考有效管电流量129 mAs/层,准直宽度为64×0.625 mm,螺距1.015,使用迭代重建(iDose),迭代等级选择3;滤过核选择Standard(B),重建图像层厚1 mm,层间距1 mm,视野300~350 mm,依患者胸部大小调整,矩阵512×512,窗宽窗位使用600/100。扫描范围从肺尖至膈顶,所有患者均在扫描前嘱平静呼吸下呼气后屏气扫描。
1.3 图像后处理方法
将原始薄层图像传至Philips星云工作站,进行多平面重组(multi planar reformation,MPR),获得横断面、冠状面和矢状面图像,同时进行最大密度投影(maximum intensity projection,MIP)。使用容积再现(volume rendering,VR),去骨,结合MIP同时显示肺动脉各段分支。
1.4 图像质量评价
1.4.1 客观评价
两组影像均测量以下血管的CT值:肺动脉主干、右肺动脉、左肺动脉,肺动脉周围分支(右肺上叶动脉、右肺中叶动脉、右肺下叶动脉、左肺上叶动脉、左肺下叶动脉)、肺静脉(右上肺静脉、右下肺静脉、左上肺静脉、左下肺静脉)、注射对比剂侧的锁骨下静脉及升主动脉。如果存在肺栓塞,仅测量未受影响的血管。ROI大小为0.05~0.6 cm2,记录CT值,并计算同侧肺动脉与肺静脉的CT值差,公式为肺动脉CT值-(同侧上肺静脉CT值+下肺静脉CT值)/2。
1.4.2 主观评价
由2名具有10年以上诊断经验的副主任医师以盲法分别对试验组和对照组图像质量进行评价。
根据既往临床诊断经验以4分制标准评价肺动脉图像质量:4分为肺动脉层面CT值≥250 HU,肺动脉及分支血管均显示良好,但是肺动脉与肺静脉CT差值>150 HU,肺静脉略强化,不影响肺动脉分支的鉴别;3分为肺动脉层面CT值≥250 HU,肺动脉及分支血管均显示良好,但是肺动脉与肺静脉CT差值≤150 HU,肺静脉明显强化,影响肺动脉分支的鉴别;2分为150 HU<肺动脉层面CT值<250 HU,肺动脉二、三级血管显影不佳;1分为肺动脉层面 CT值≤150 HU,说明肺动脉强化效果弱,无法明确诊断分支血管。
采用4分制评分法评价上腔静脉硬化伪影:4分,无硬化伪影;3分,硬化伪影可忽略;2分,硬化伪影明显,但肺动脉可显示,尚能诊断;1分,硬化伪影严重影响肺动脉的显示和诊断。
1.5 统计学处理
采用SPSS 23.0软件进行统计分析,采用Shapiro-Wilk检验对数据行正态性分析,符合正态分布的计量资料用
$(\bar{x}\pm s)$ 表示,不符合正态分布用${M}({Q_1}, {Q_3})$ 表示。试验组与对照组患者性别比较采用卡方检验;年龄、BMI、血管CT值的比较采用独立样本t检验;肺动脉图像质量评分、上腔静脉硬化伪影评分的比较采用非参数Mann-Whitney U检验。两名医师间图像质量主观评价的一致性采用Kappa检验,Kappa值<0.40提示两者一致性差,0.41~0.60为一致性一般,0.61~0.80为一致性好,>0.80为一致性非常好。P<0.05为差异有统计学意义。
2. 结果
2.1 一般资料分析结果
试验组和对照组患者性别、年龄、BMI差异均无统计学意义。试验组和对照组通过CTPA检查诊断为肺栓塞的分别为3例和2例。
试验组30例患者均获得良好的肺动脉强化效果,3例患者出现肺静脉强化,干扰肺动脉的观察,而对照组有8例患者肺静脉强化明显。试验组肺静脉强化原因是跟踪ROI时因为呼吸运动ROI有的期相不在跟踪层面,导致ROI达到阈值时间延迟。对照组肺静脉强化原因主要是测试达峰时间误差或启动扫描延迟所致(图2)。
![]() 图 2 对照组患者使用小剂量团注测试技术,试验组患者使用两段式对比剂注射结合团注跟踪技术(a)和(b)为对照组组患者,(a)横轴位厚层MIP图像,(b)冠状位厚层MIP图像,因扫描启动过晚导致肺静脉强化,肺动脉与肺静脉CT值差值小于150 HU,图像质量评分为3分;(c)和(d)为试验组患者,(c)横轴位厚层MIP图像,(d)冠状位厚层MIP图像,肺静脉略显影,肺动脉处于强化峰值,与肺静脉有良好的对比,CT值差值大于150 HU,图像质量评分为4分。Figure 2. The control groups, using the test bolus technique, and the experimental groups, using a two-stage injection of contrast agent combined with bolus tracking technique
图 2 对照组患者使用小剂量团注测试技术,试验组患者使用两段式对比剂注射结合团注跟踪技术(a)和(b)为对照组组患者,(a)横轴位厚层MIP图像,(b)冠状位厚层MIP图像,因扫描启动过晚导致肺静脉强化,肺动脉与肺静脉CT值差值小于150 HU,图像质量评分为3分;(c)和(d)为试验组患者,(c)横轴位厚层MIP图像,(d)冠状位厚层MIP图像,肺静脉略显影,肺动脉处于强化峰值,与肺静脉有良好的对比,CT值差值大于150 HU,图像质量评分为4分。Figure 2. The control groups, using the test bolus technique, and the experimental groups, using a two-stage injection of contrast agent combined with bolus tracking technique2.2 客观评价
试验组和对照组所测量血管CT值见表1,其中左肺动脉、右肺上叶动脉、右肺中叶动脉、右肺下叶动脉、左肺上叶动脉、升主动脉CT值差异有统计学意义,试验组CT值大于对照组;肺动脉主干、右肺动脉、左肺下叶动脉、右上肺静脉、右下肺静脉、左上肺静脉、左下肺静脉、锁骨下静脉、右侧动静脉CT值差值、左侧动静脉CT值差值差异无统计学意义。
表 1 试验组和对照组测量血管的平均值、最小值和最大值的比较Table 1. Comparison of mean, minimum, and maximum values of measured vessels between the experimental and control groups测量血管 CT值/HU 统计检验 试验组$\bar{x}\pm s$(min~max) 对照组$\bar{x}\pm s$(min~max) t P 肺动脉主干 340±50(264~431) 312±65(183~483) 1.86 0.067 右肺动脉 339±51(251~435) 313±58(180~463) 1.86 0.068 左肺动脉 345±54(252~431) 314±57(188~466) 2.21 0.031 右肺上叶动脉 367±62(281~498) 329±61(185~497) 2.40 0.020 右肺中叶动脉 359±61(269~468) 322±58(202~472) 2.39 0.020 右肺下叶动脉 363±58(268~511) 329±61(206~469) 2.19 0.033 左肺上叶动脉 362±54(258~441) 330±59(197~467) 2.18 0.033 左肺下叶动脉 362±57(259~457) 332±63(195~474) 1.89 0.064 右上肺静脉 137±39(85~225) 128±57(40~263) 0.74 0.462 右下肺静脉 132±30(86~192) 122±53(45~225) 0.86 0.392 左上肺静脉 137±37(89~226) 134±56(42~265) 0.20 0.841 左下肺静脉 135±35(91~228) 124±52(40~244) 0.90 0.375 锁骨下静脉 935±250(469~1728) 840±303(317~1645) 1.32 0.193 升主动脉 120±21(84~165) 71±19(44~120) 9.50 0.000 右侧动静脉CT值差值 204±57(86~289) 188±89(-17~374) 0.87 0.389 左侧动静脉CT值差值 210±61(70~301) 184±86(6~376) 1.31 0.195 注:$\bar{x}\pm s$为平均值±标准差,min为最小值,max为最大值。 2.3 主观评价
两名医师对试验组和对照组肺动脉影像质量、上腔静脉硬化伪影评分结果见表2。两名医师间评分结果一致性好(Kappa值均>0.61,表2)。试验组和对照组肺动脉影像质量评分差异无统计学意义;试验组和对照组上腔静脉硬化伪影评分差异无统计学意义。
表 2 两名医师对试验组和对照组肺动脉影像质量、上腔静脉伪影评分分布和一致性分析结果Table 2. Distribution and consistency of pulmonary artery image quality and superior vena sclerotic artifact scores analyzed by two physicians in the experimental and control groups组别 医师1/例 医师2/例 评分
$({M}({Q}_{1}, t{Q}_{3} ))$一致性分析 4分 3分 2分 1分 4分 3分 2分 1分 Kappa值 P 肺动脉图像质量评分 试验组 22 8 0 0 23 7 0 0 4.0(3.5,4.0) 0.73 <0.001 对照组 15 13 2 0 19 11 0 0 3.75(3.0,4.0) 0.62 <0.001 上腔静脉硬化伪影评分 试验组 4 22 4 0 2 24 4 0 3.0(3.0,3.0) 0.66 <0.001 对照组 2 24 4 0 2 19 9 0 3.0(2.5,3.0) 0.63 <0.001 3. 讨论
优质的CTPA图像是肺动脉及分支充分强化,肺静脉略强化,并与肺动脉有良好的对比,以区分肺动脉和肺静脉,同时上腔静脉没有对比剂硬化伪影或硬化伪影极少,不影响肺动脉的观察[2],这决定了CTPA要在肺动脉达到峰值时,上腔静脉内对比剂峰值已过,同时要在肺静脉充分强化前完成扫描,由于肺动脉循环很快,肺动脉到肺静脉的循环时间仅2~3 s,可利用的增强时间窗非常窄,这就要求对比剂的注射时间短,同时扫描速度要快,而64排CT基本可以将肺动脉扫描时间控制在3 s,因此对比剂用量不需要太多,根据既往研究[2],按照注射流率5 mL/s,20 mL对比剂完全可以满足肺动脉增强要求,但是较短的对比剂注射时间对肺动脉增强峰值的把握提出了较高的要求,准确确定CTPA扫描延迟时间异常关键。
延迟时间的选择目前常用的方法有小剂量团注测试技术和对比剂团注跟踪技术,小剂量团注测试技术能够有效地反映肺循环信息,有利于把握准确的扫描时机[2-4],但是操作步骤多,且受操作环境及人为因素影响较大,对比剂启动注射与CT启动扫描的一致性很难做到绝对一致,由此产生的误差影响了预实验测试肺动脉增强峰值时间的准确性,并且有的机器并不具备测试达峰时间的程序。对比剂团注跟踪技术作为一种简单有效地方法,普遍应用于各种CT血管成像[5-6],相较于小剂量团注测试技术,对比剂团注跟踪技术更具个性化[7],受患者个体循环差异影响小。
过渡延迟时间是对比剂团注跟踪技术中一个重要的参数,指的是ROI到达阈值切换到正式扫描之间的时间,这段时间内设备需要完成扫描前准备工作(扫描床移动到扫描起始位置)以及向患者发出检查所需要的呼吸指令,此时间也与设备本身有关,一般在4~7 s。多数研究将ROI置于肺动脉主干[8-9],由于此时间大于肺循环时间,这就导致肺静脉强化,影响肺动脉的观察,同时需要更多的对比剂注射时间以及对比剂用量。
针对此问题,有研究将上腔静脉及头臂干静脉设为ROI[10-11],虽然肺静脉不成像但是受心功能影响较大,容易造成检查失败。也有学者使用3期团注法对比剂注射方案[12]或多期双流混合注射方案[13],以肺动脉主干为ROI,第Ⅰ期注射混合液的对比剂浓度低,起到达阈值触发扫描的作用,同时注射混合液所用时间抵消触发后启动扫描的时间,第Ⅱ期对比剂到达时开始扫描,第Ⅰ期混合液进入肺静脉强化程度低,对肺动脉的观察不会造成影响,提高了检查的成功率。此方案虽然第一期混合液与第Ⅱ期对比剂注射流率一致,但是对比剂浓度不一致,两期对比剂的相对注射流率不一致,其达峰时间不一样,混合液达到设定阈值的时间过晚仍会导致检查失败发生。
本研究借鉴CT血管成像中小剂量团注测试技术的一些研究[2-4,7,14-15],这些研究测试达峰时间的小剂量对比剂与进行正式扫描的对比剂都使用了相同的浓度和相同的注射流率。基于此,本研究跟踪肺动脉主干的CT值,将测试达峰时间的小剂量对比剂和正式扫描的对比剂以相同注射流率(5 mL/s)分两段注射,中间注射相同流率生理盐水以抵消过渡延迟时间,注射方法是先注射2 s的对比剂,然后注射6 s生理盐水,再注射4 s对比剂,然后注射6 s生理盐水,过渡延迟时间设为10 s。由于两段对比剂的开始注射时间间隔是8 s,且注射流率相同,第1段对比剂达到设定阈值后8 s,第2段对比剂也将达到设定阈值,在此基础上再延迟2 s扫描,相当于第2段对比剂达到设定阈值后2 s开始扫描,此时第2段对比剂刚好完成一次肺循环,不会对肺静脉产生明显强化,而第1段对比剂达到设定阈值后10 s,大部分已经循环出肺静脉。此方法间接实现了将过渡延迟时间设定为2 s,解决了多数设备过渡延迟时间过长的问题,节省了对比剂用量,提高了检查的成功率。
本研究中,试验组部分肺动脉血管CT值高于对照组,其他肺动脉血管CT值及锁骨下静脉CT值、肺静脉CT值、动静脉CT值差值均与对照组无差异,且两组图像在肺动脉图像质量和上腔静脉硬化伪影评分方面均无差异。本研究中,试验组升主动脉的CT值高于对照组,这与第1段对比剂流入胸主动脉导致胸主动脉部分强化有关,本研究中升主动脉CT值均<165 HU,不影响肺动脉的观察。同时本研究在扫描前嘱患者平静呼吸呼气末屏气,以减少因为过度吸气导致下腔静脉血大量回流入右心房,稀释右心腔对比剂产生肺动脉强化不佳的情况[16-18]。
综上,本研究在进行肺动脉CTA检查时使用两段式对比剂同速注射结合团注跟踪技术,可获得稳定的图像质量,其图像质量不低于传统的小剂量团注测试技术,且团注跟踪技术操作简单易行,受操作者个人影响较小。同时本研究通过在两段对比剂中间注射生理盐水抵消过渡延迟时间的方法,将过渡延迟时间设定为10 s,适用于大多数机器,值得在临床上推广。
本研究的不足:①第一段对比剂在 10 s后大部分流入胸主动脉,导致胸主动脉强化,更有部分心功能不佳患者,第一段对比剂在10 s仍残留于肺静脉,影响肺动脉观察,这种情况要增加两段对比剂之间的生理盐水注射时间,同时增加过渡延迟时间,使第1段对比剂有充足的时间循环流出,而过渡延迟时间只需设定为两段对比剂开始注射间隔时间+2 s即可;②本研究第 2段对比剂用量为 20 mL,注射时间为4 s,要求设备扫描快,适用于将扫描时间控制在2~3 s的设备,如果设备扫描速度过慢,要适当增加第2段对比剂的用量;③本研究未将超重人群纳入,对于超重人群,20 mL对比剂是否适用需要进一步研究。
-
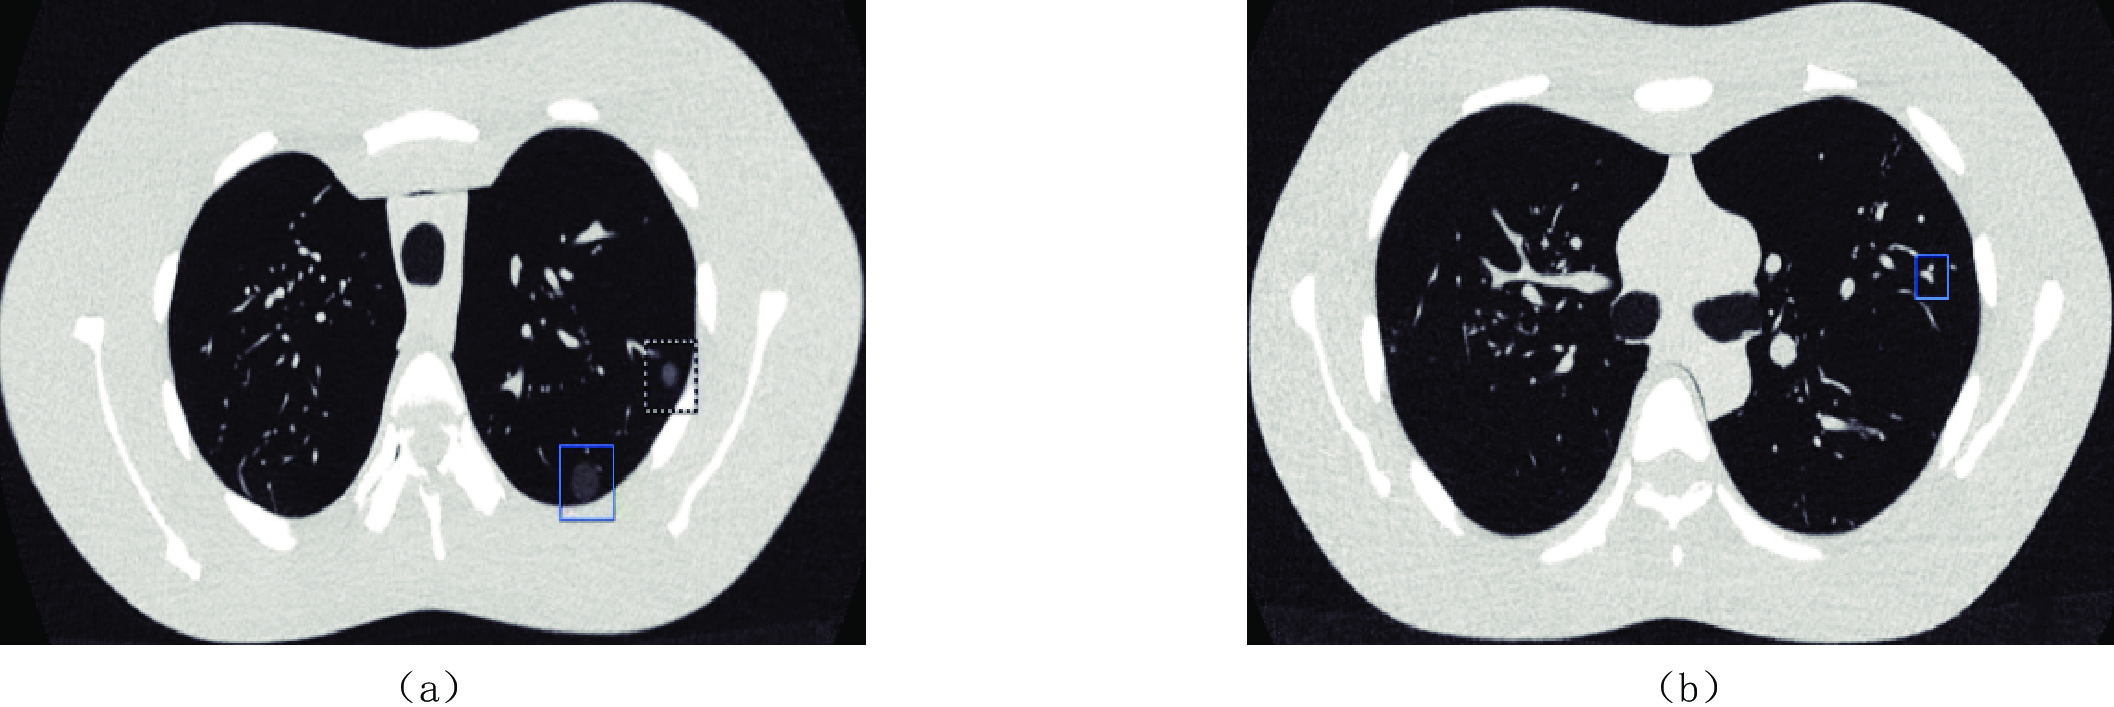
![]()
图 1 AI检出真阳性结节和假阳性结节示例
注:(a)真阳性结节检出:左肺胸膜下区检出1个 - 800 HU、10 mm肺结节(蓝方形框)和1个 - 650 HU、5 mm肺结节(白方形框);(b)假阳性结节检出:左肺实质内检出1个假阳性结节,实为肺血管横断面(蓝方形框)。
Figure 1. True positive nodules and false positive nodules detected by artificial intelligence
表 1 AI对不同剂量扫描时肺结节的检出结果(n=135)
Table 1 Results of pulmonary nodules detected by artificial intellgence at different doses
3D自动管电流调制(ATCM) 真阳性结节数/个 真阳性率/% 假阳性结节数/个 高剂量 107 79.26 10 常规剂量 108 80.00 12 低剂量 111 82.22 21 P 0.90 高剂量vs.常规剂量 0.88 高剂量vs.低剂量 0.76 常规剂量vs.低剂量 0.64  下载: 导出CSV
表 2 AI对不同降噪权重AIDR 3D算法肺结节的检出结果(n=135)
Table 2 Results of lung nodules detected by AIDR three-dimensional algorithm with different noise reduction weights by artificial intelligence
AIDR 3D算法 真阳性结节数/个 真阳性率/% 假阳性结节数/个 Mild 108 78.26 9 Standard 107 79.26 12 Strong 114 84.44 22 P 0.67 Mild vs. Standard 1.00 Mild vs. Strong 0.43 Standard vs. Strong 0.43
下载: 导出CSV
表 3 AI对不同重建层厚图像肺结节的检出结果(n=135)
Table 3 Results of lung nodules detected by AI in images with different reconstructed layers
重建层厚/mm 真阳性结节数/个 真阳性率/% 假阳性结节数/个 1(薄层) 108 80.00 12 7(厚层) 83 61.48 4 P 0.00
下载: 导出CSV
表 4 AI对不同胸部位置肺结节的检出结果(n=45)
Table 4 Results of artificial intelligence detection of pulmonary nodules at different chest locations
肺结节所在胸部位置 真阳性结节数/个 真阳性率/% 假阳性结节数/个 胸膜下 40 88.89 2 纵隔旁 30 66.67 1 肺实质 38 84.44 9 P 0.02 胸膜下 vs. 纵隔旁 0.01 胸膜下 vs. 肺实质 0.59 纵隔旁 vs.肺实质 0.03
下载: 导出CSV
表 5 AI对不同大小肺结节的检出结果
Table 5 Results of AI detection of pulmonary nodules with different sizes
肺结节直径/mm 真阳性结节数/个 真阳性率/% ≤5(n=54) 32 59.26 ≥8(n=81) 76 94.83 P 0.00
下载: 导出CSV
表 6 AI对不同密度肺结节的检出结果(n=45)
Table 6 Results of artificial intelligence detection of pulmonary nodules with different densities
肺结节密度/HU 真阳性结节数/个 真阳性率/% 100(实性结节) 35 77.78 -650(磨玻璃结节) 40 88.89 -800(磨玻璃结节) 33 73.33 P 0.17 100 HU vs. -650 HU 0.19 100 HU vs. -800 HU 0.60 -650 HU vs. -800 HU 0.07
下载: 导出CSV
-
[1] 庹敏, 侯梦婷, 鲍娟. 人工智能在医疗领域的应用现状和思考[J]. 中国现代医生, 2022, 60(22): 72−75. DOI: 10.3969/j.issn.1673-9701.2022.22.zwkjzlml-yyws202222017. TUO M, HOU M T, BAO J. Application status and thinking of artificial intelligence in medical field[J]. Chinese Modern Doctor, 2022, 60(22): 72−75. DOI: 10.3969/j.issn.1673-9701.2022.22.zwkjzlml-yyws202222017. (in Chinese).
[2] 明佳蕾, 方向明. 基于人工智能的CT肺结节检出临床应用及研究进展[J]. 中华放射学杂志, 2019, 53(6): 522−525. DOI: 10.3760/cma.j.issn.1005-1201.2019.06.017. MING J L, FANG X M. Clinical application and research progress of lung nodule detection using artificial intelligence CT[J]. Chinese Journal of Radiology, 2019, 53(6): 522−525. DOI: 10.3760/cma.j.issn.1005-1201.2019.06.017. (in Chinese).
[3] LI K, LIU K F, ZHONG Y H, et al. Assessing the predictive accuracy of lung cancer, metastases, and benign lesions using an artificial intelligence-driven computer aided diagnosis system[J]. Quantitative Imaging in Medicine and Surgery, 2021, 11(8): 3629−3642. DOI: 10.21037/qims-20-1314.
[4] KANG S M, KIM T H, SHIN J M, et al. Optimization of a chest computed tomography protocol for detecting pure ground glass opacity nodules: A feasibility study with a computer-assisted detection system and a lung cancer screening phantom[J]. PLOS ONE, 2020, E15(5): e0232688.
[5] SOLOMON J, MARIN D, ROY CHOUDHURY K, et al. Effect of radiation dose reduction and reconstruction algorithm on image noise, contrast, resolution, and detectability of subtle hypoattenuating liver lesions at multidetector CT: Filtered back projection versus a commercial model-based iterative reconstruction algorithm[J]. Radiology, 2017, 284: 777−787. DOI: 10.1148/radiol.2017161736.
[6] JIN H, LI Z, TONG R, et al. A deep 3D residual CNN for false-positine in pulmonary nodule detection[J]. Medical Physics, 2018, 45(5): 2097−2107. DOI: 10.1002/mp.12846.
[7] SILVA M, SCHAEFER-PROKOP C M, JACOBS C, et al. Detection of subsolid nodules in lung cancer screening: Complementary sensitivity of visual reading and computer-aided diagnosis[J]. Investigative Radiology, 2018, 53(8): 441−449. DOI: 10.1097/RLI.0000000000000464.
[8] NARAYANAN B N, HARDIE R G, KEBEDE T M, et al. Performence analysis of a computer-aided detection system for lung nodules in CT at different slice thickness[J]. Journal of Medical Imaging, 2018, 5(1): 014504.
[9] MESSERLI M, KLUCKERT T, KNITEL M, et al. Computer-aided detection (CAD) of solid pulmonary nodules in chest X-ray equivalent ultralow dose chest CT-first in-vivo result at dose level of 0.13 mSv[J]. European Journal of Radiology, 2016, 85(12): 2217−2224. DOI: 10.1016/j.ejrad.2016.10.006.
[10] GODOY M C, KIM T J, WHITE C S, et al. Benefit of computer-aided detection analysis for the detection of subsolid and solid lung nodules on thin and thick-section CT[J]. American Journal of Roentgenology, 2013, 200(1): 74−83. DOI: 10.2214/AJR.11.7532.
[11] 赵峰, 曾勇明, 彭刚, 等. 胸部低剂量CT扫描管电流与噪声分布相关性研究[J]. 中华放射医学与防护杂志, 2012, 32(1): 100−103. DOI: 10.3760/cma.j.issn.0254-5098.2012.01.030. ZHAO F, ZENG Y M, PENG G, et al. Correlation between the tube current and image noise in low-dose chest CT scean[J]. Chinese Journal of Radiological Medicine and Protection, 2012, 32(1): 100−103. DOI: 10.3760/cma.j.issn.0254-5098.2012.01.030. (in Chinese).
[12] BAN K T, KIM J S, NA Y H, et al. Pulmonary nodules: Automated detection on CT image with morphologic matching algorithm-preliminary results[J]. Radiology, 2005, 236(1): 286−293. DOI: 10.1148/radiol.2361041286.
[13] HAN H, LI L, HAN F, et al. Fast and adaptive detection of pulmonary nodules in thoracic CT images using a hierarchical vecter quantization scheme[J]. IEEE Journal of Biomedical and Health Informatics, 2015, 19(2): 648−659.
[14] BROWN M S, LO P, GOLDIN J C, et al. Toward clinically usable CAD for lung cancer screening with computed tomography[J]. European Radiology, 2014, 24(11): 2719−2728. DOI: 10.1007/s00330-014-3329-0.
[15] SETIO A A, CIOMPI F, LATJENS G et al. Pulmonary nodules detection in CT image: False positive redution using multi-view convolutional networks[J]. IEEE Transactions on Medical Imaging, 2016, 35(5): 1160−1169. DOI: 10.1109/TMI.2016.2536809.
[16] HAN G, LIU X, ZHENG G, et al. Automatic recognition of 3D GGO CT imaging signs through the fusion of hybird resampling and layer-wise finetining CNNs[J]. Medical & Biological Engineering & Computing, 2018, 56(12): 2201−2212.
[17] FU B J, WANG G S, WU M Y, et al. Influence of CT effffective dose and convolution kernel on the detection of pulmonary nodules in difffferent artifificial intelligence software systems: A phantom study[J]. European Journal of Radiology, 2020, 126: 108928. DOI: 10.1016/j.ejrad.2020.108928.
-
期刊类型引用(3)
1. 杨文杰,梁烨,杨柯. 双流法肺动脉技术在肺动脉扫描中的应用评价. 影像诊断与介入放射学. 2024(04): 278-282 .  百度学术
百度学术
2. 胡嘉诚,刘云福,王新艳,王倩,马梓轩,张永县,李伟,刘荣,牛延涛. 对比剂分次团注联合能量成像获得CTU和CTA联合成像的应用研究. CT理论与应用研究. 2024(06): 692-700 . 本站查看
3. 肖爱兰. 基于肺动脉CTA对肺栓塞检出流程优化的探讨. 现代医用影像学. 2024(09): 1644-1646+1656 . 百度学术
其他类型引用(0)


计量
- 文章访问数: 166
- HTML全文浏览量: 51
- PDF下载量: 38
- 被引次数: 3


