Video Player is loading.
This is a modal window.
The media could not be loaded, either because the server or network failed or because the format is not supported.
Figures of the Article
-
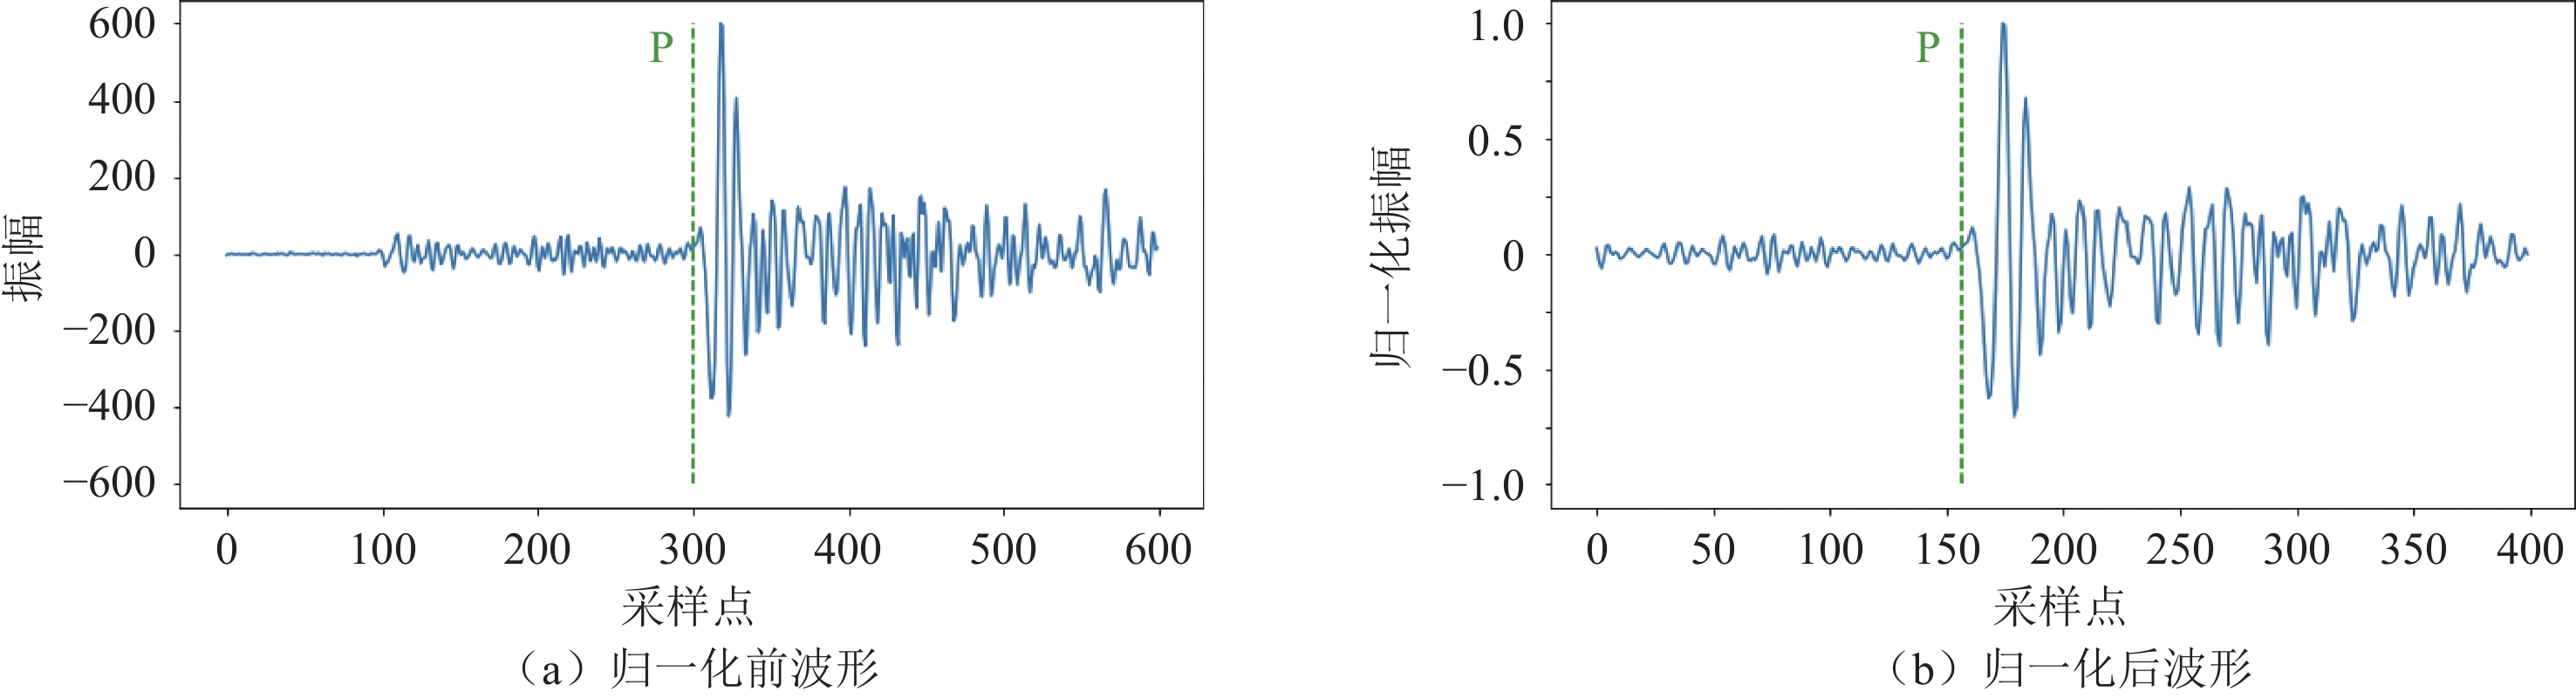
![]() Example of the seismic waveform after normalization. The dashed green line shows the primary arrival of the P wave
Example of the seismic waveform after normalization. The dashed green line shows the primary arrival of the P wave
-
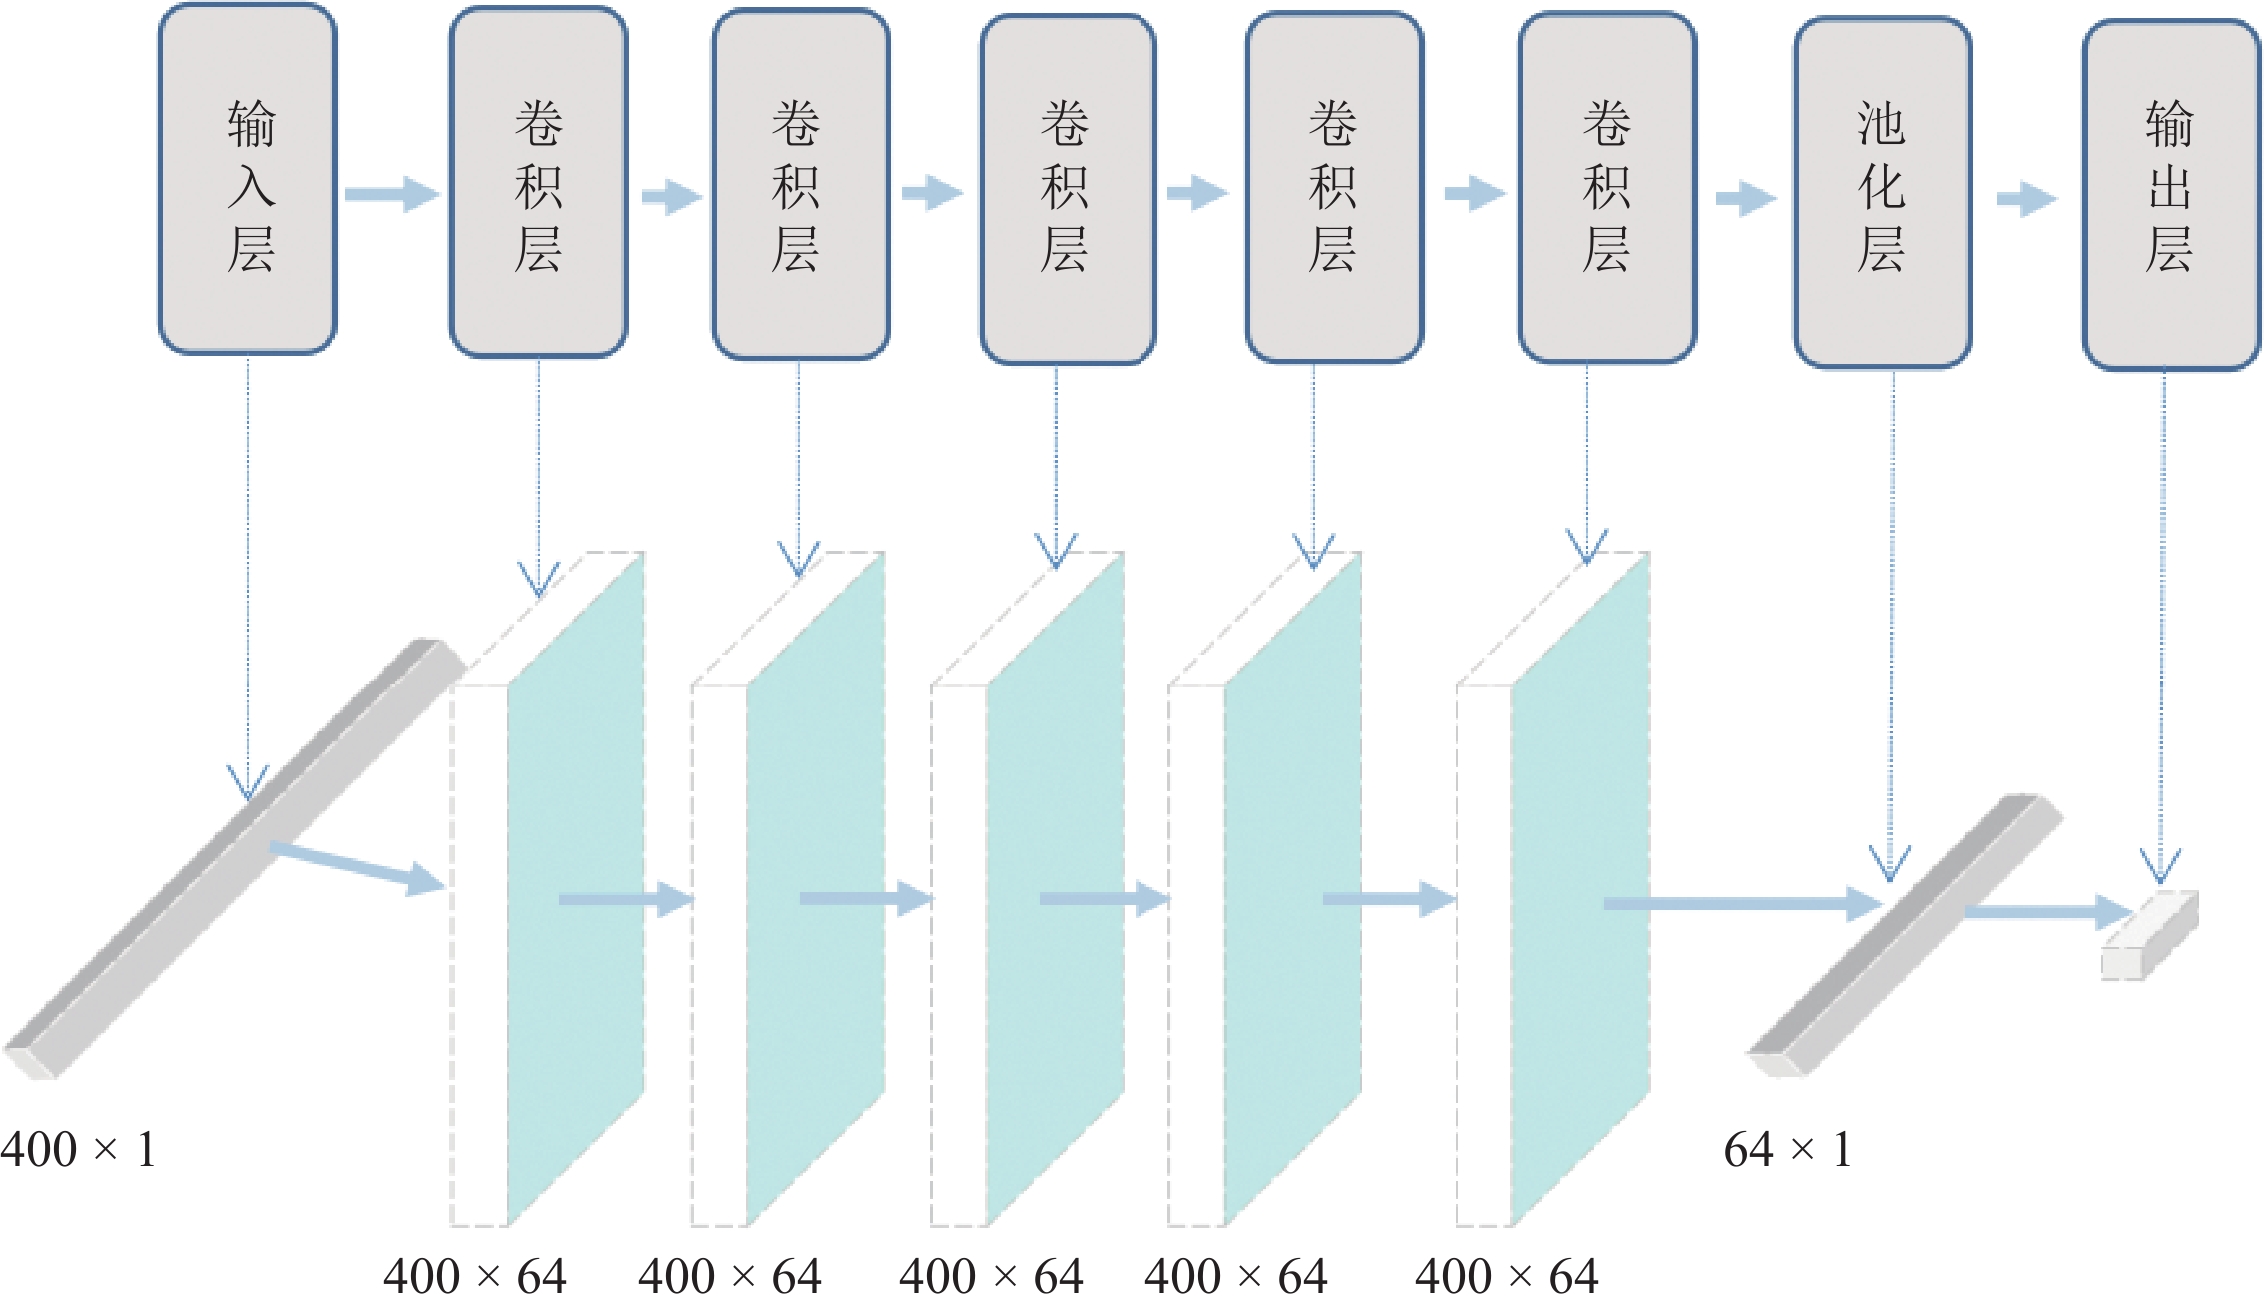
![]() Schematic of the CNN model and output matrix size of each layer
Schematic of the CNN model and output matrix size of each layer
-
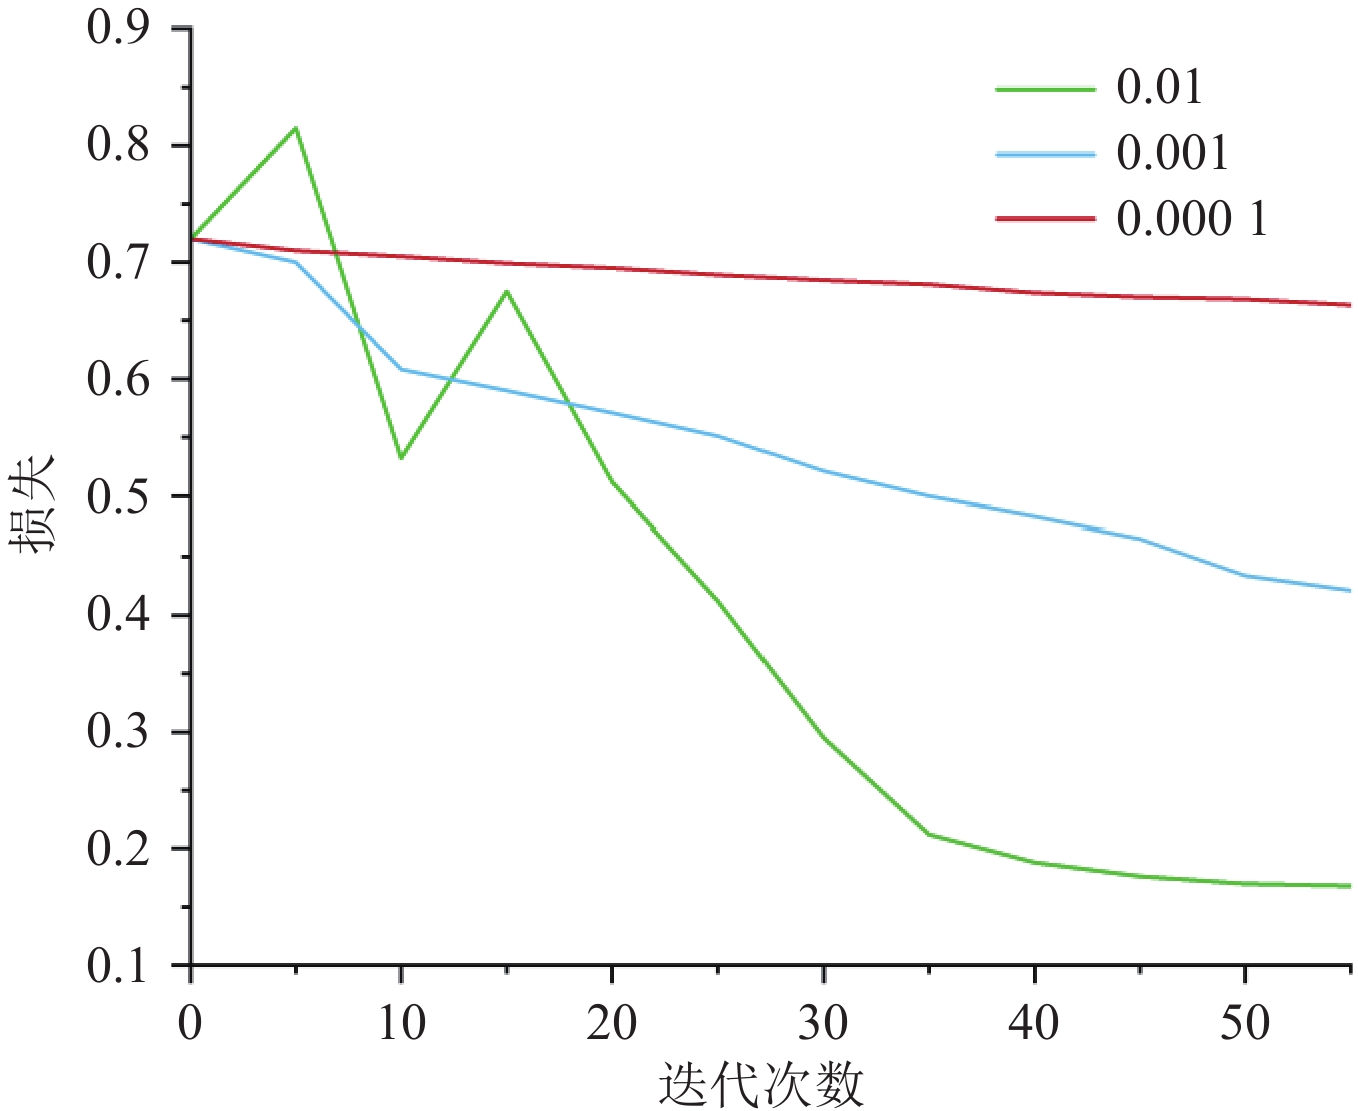
![]() Results of loss function reduction with different learning rates
Results of loss function reduction with different learning rates
-
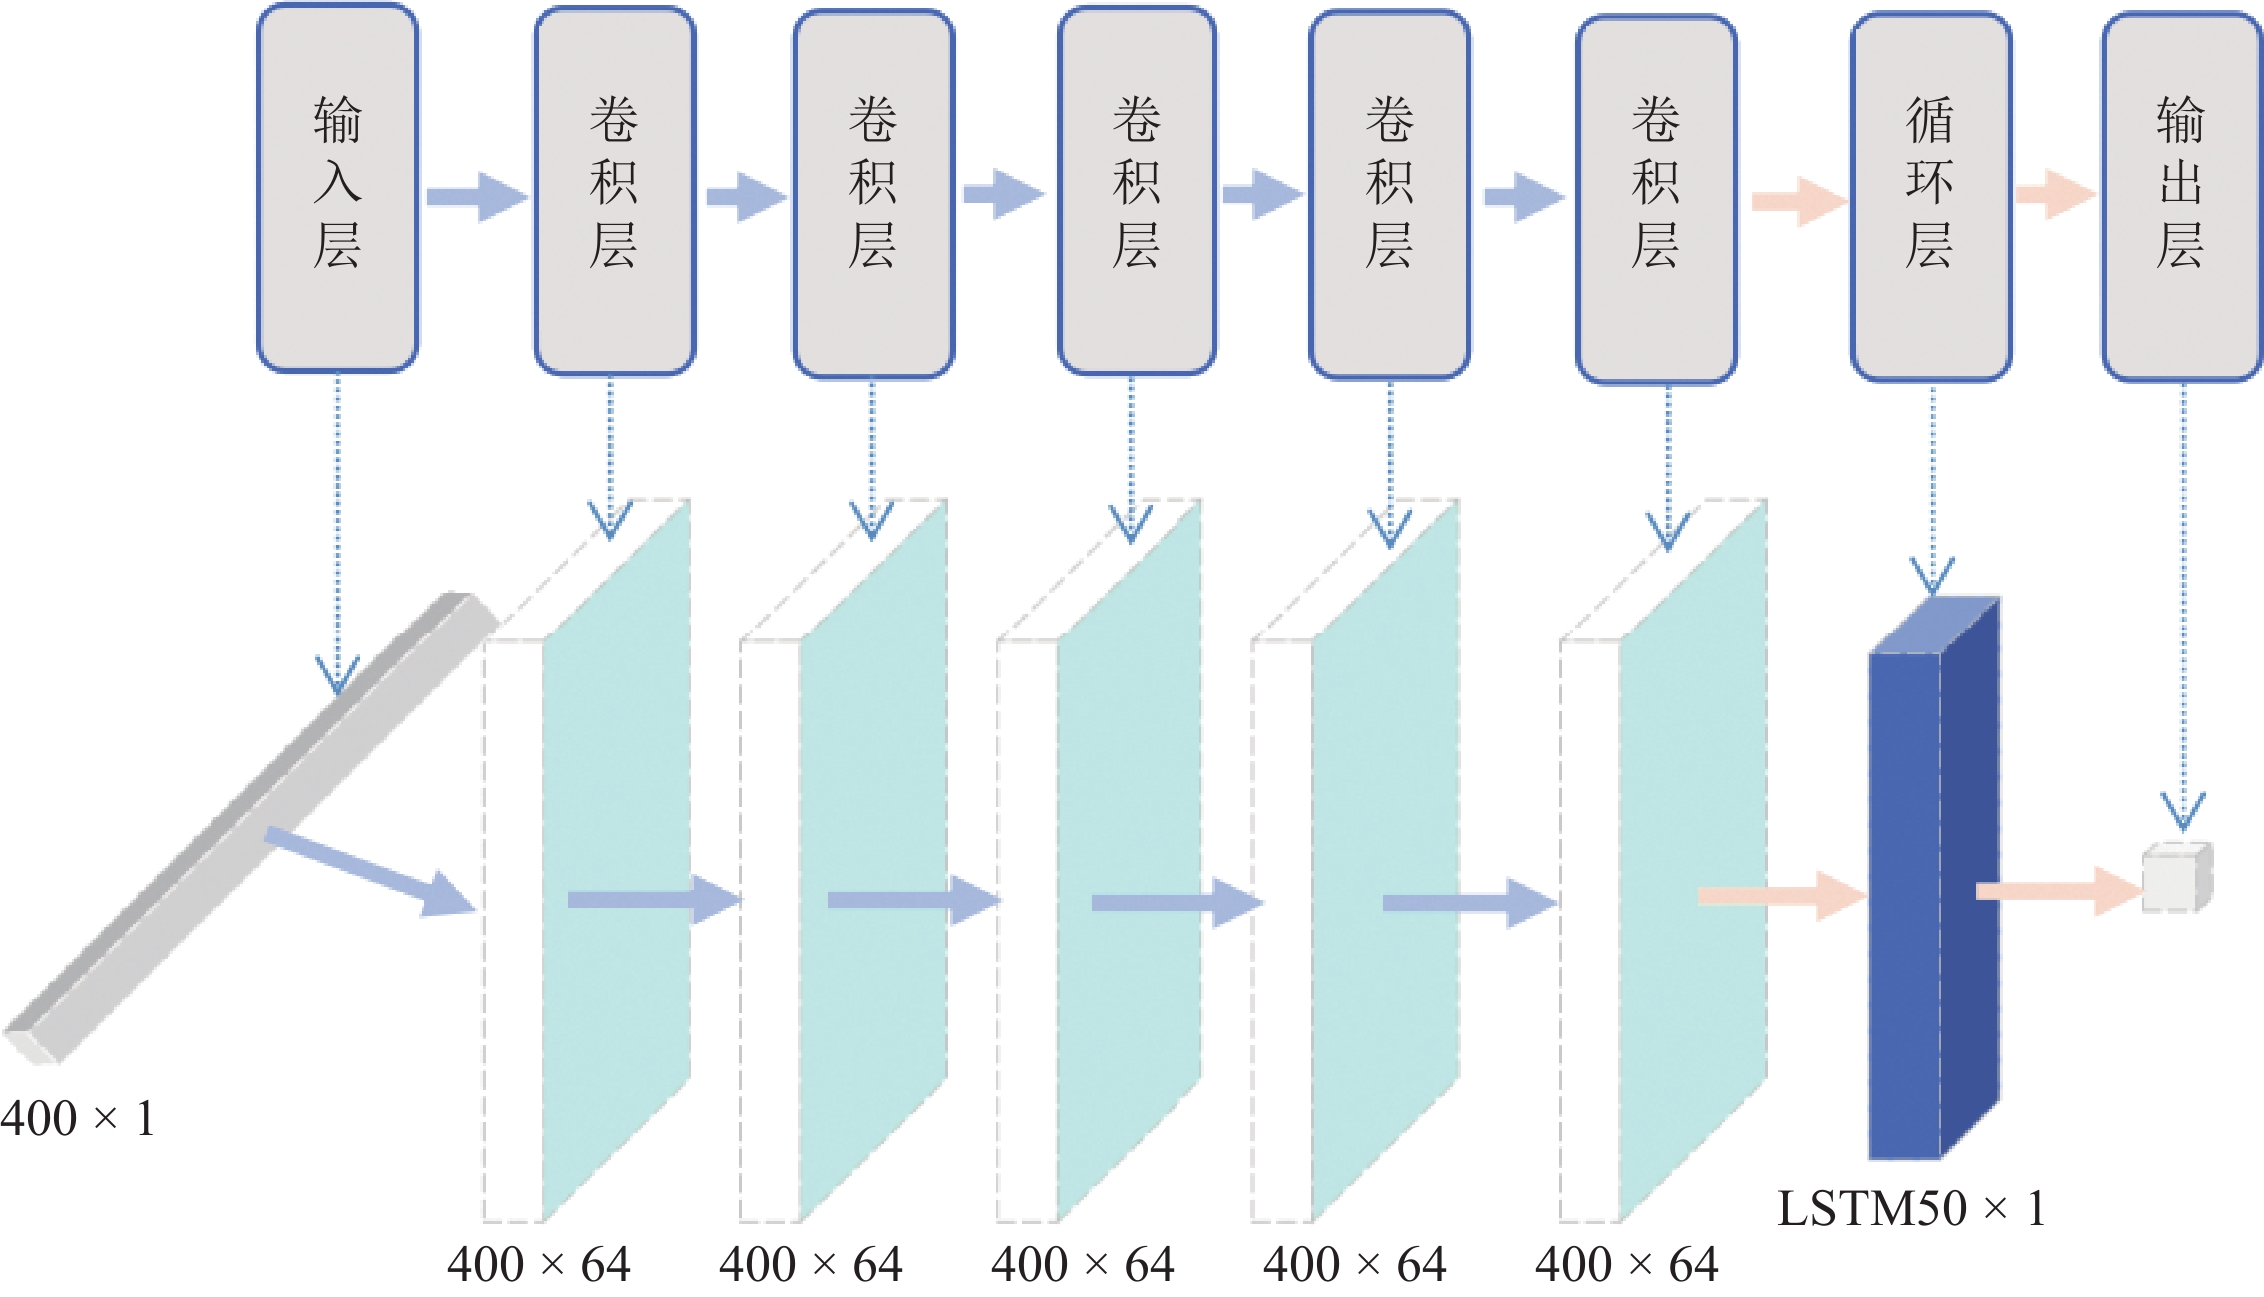
![]() Schematic diagram of the structure of the (CRNN) and the size of the output matrix of each layer
Schematic diagram of the structure of the (CRNN) and the size of the output matrix of each layer
-
![]() Comparison of travel time residuals for CRNN and AR pickers
Comparison of travel time residuals for CRNN and AR pickers
-
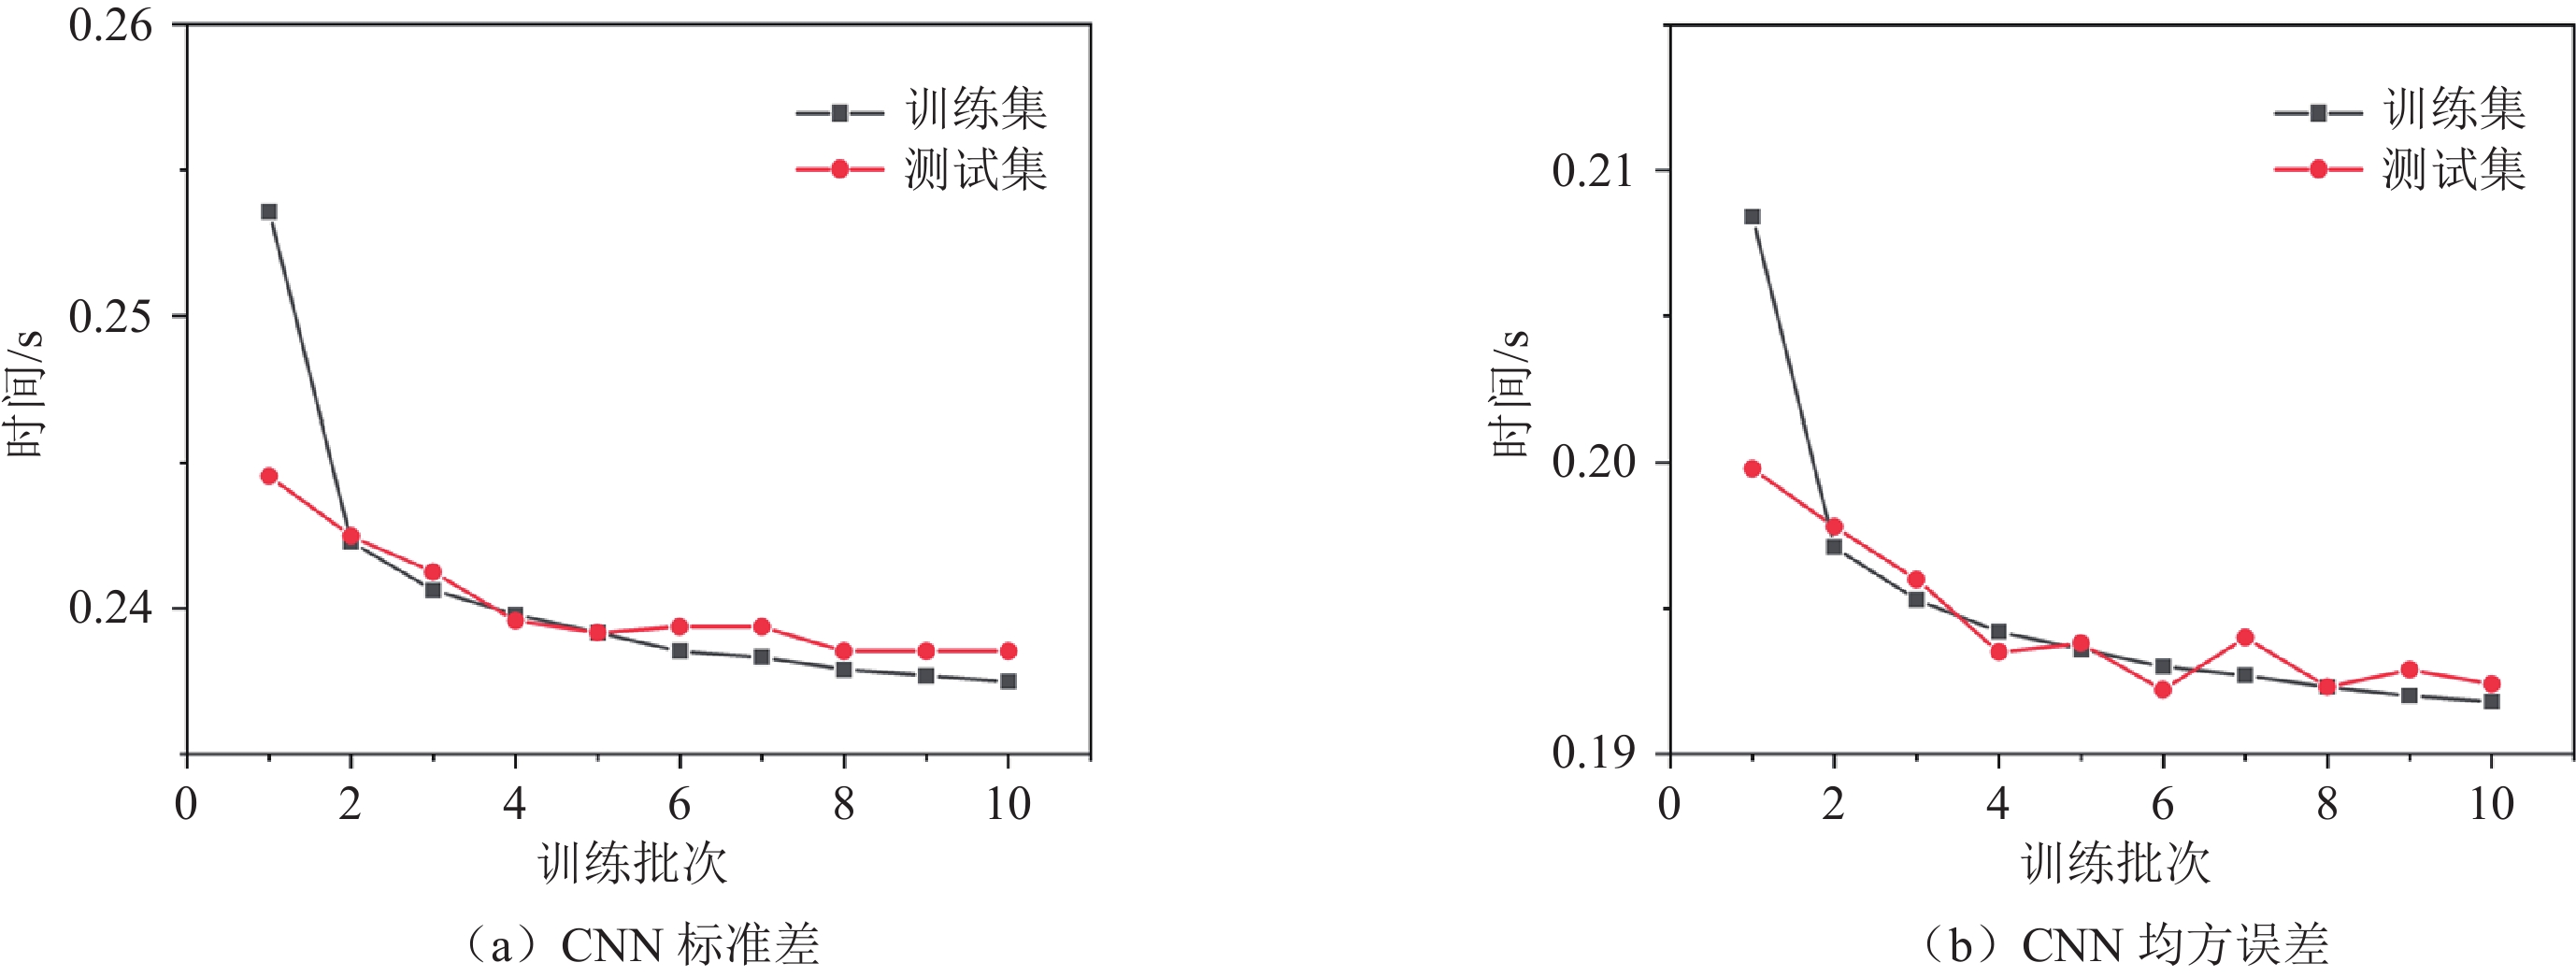
![]() Variations in standard deviation and mean square error of the CNN model with iterations
Variations in standard deviation and mean square error of the CNN model with iterations
-
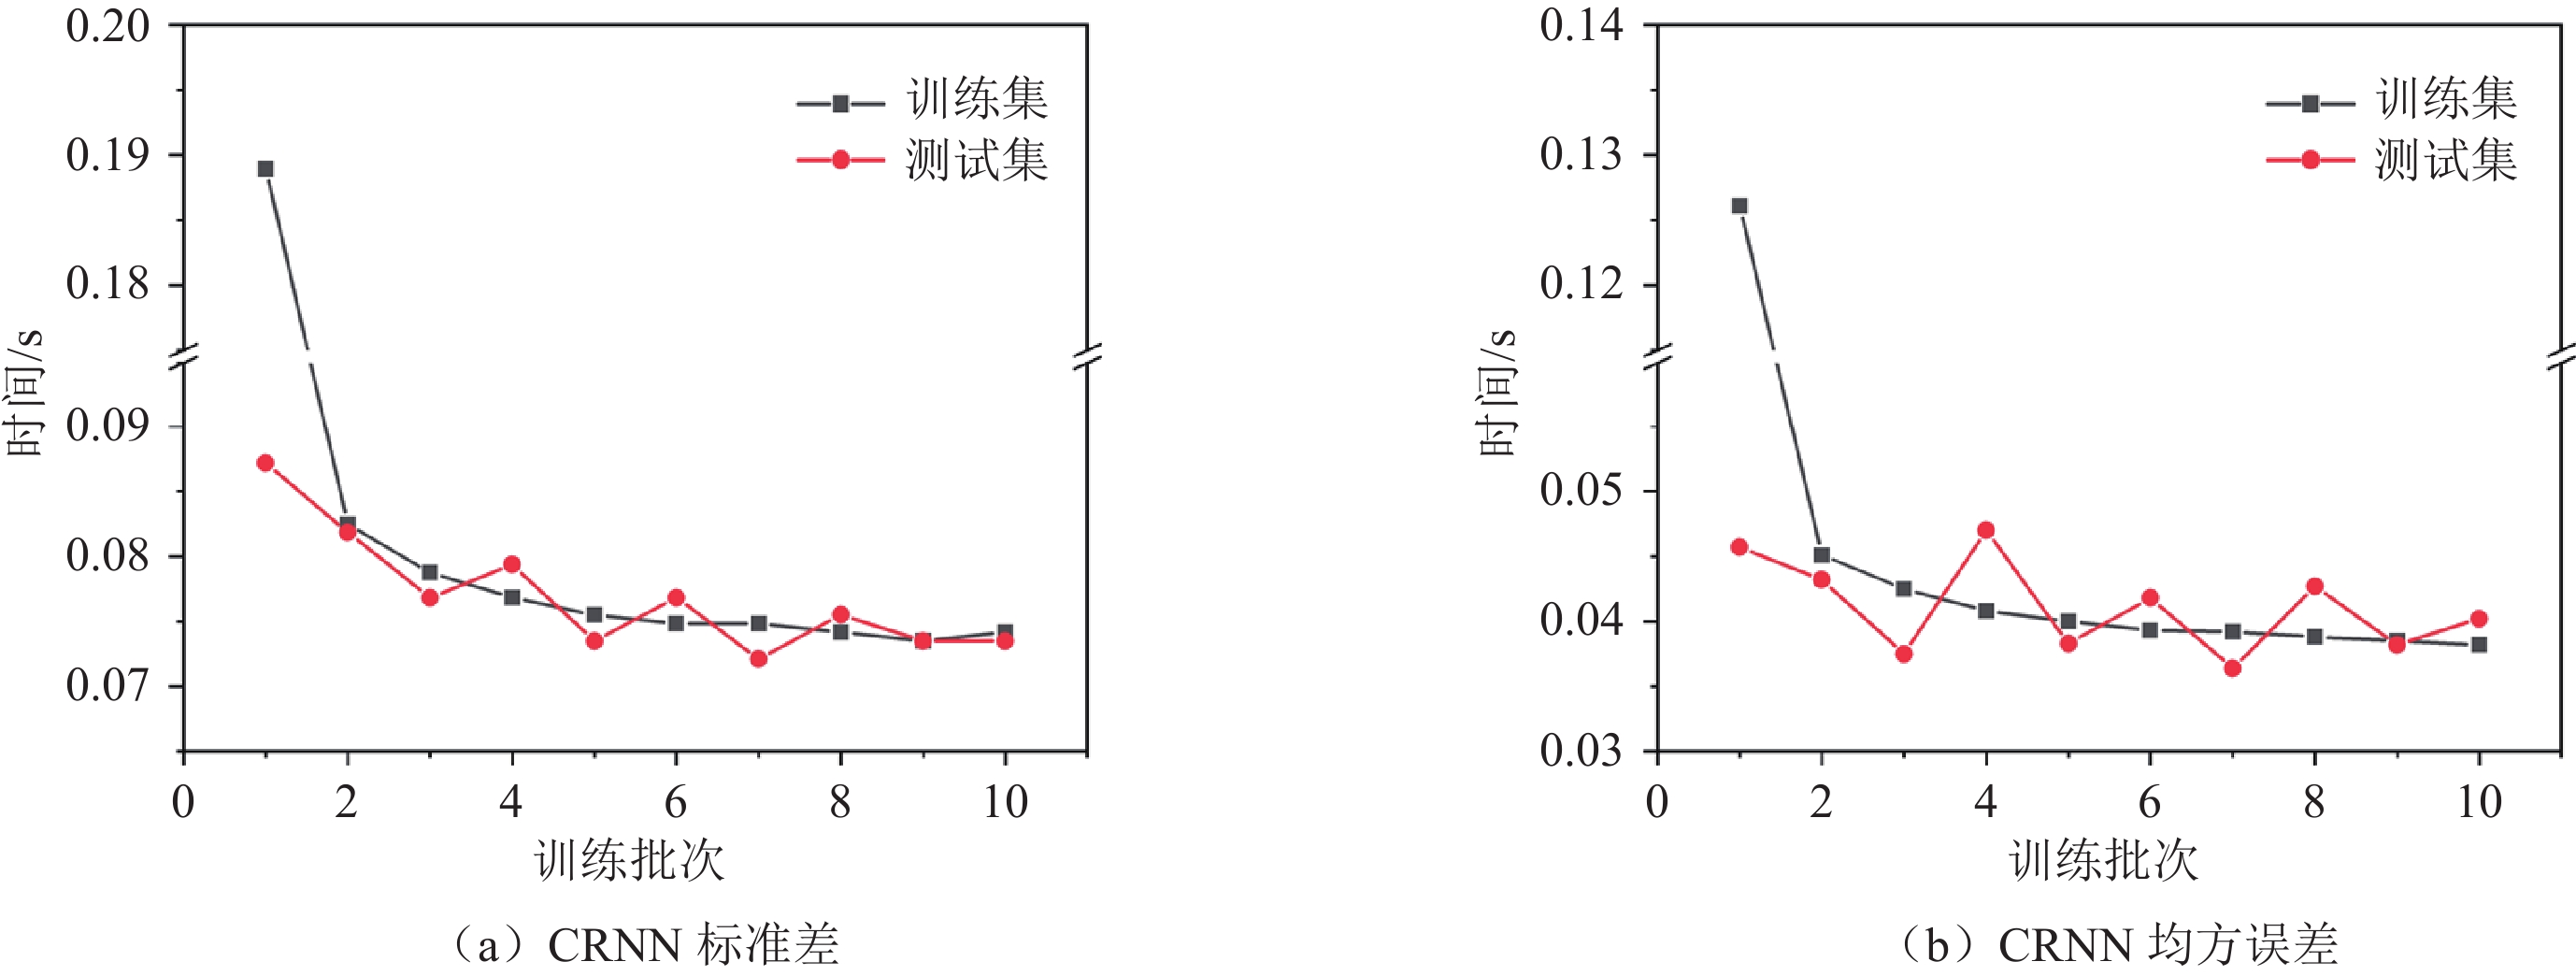
![]() Variations in the standard deviation and mean square error of the CRNN model with iterations
Variations in the standard deviation and mean square error of the CRNN model with iterations
-
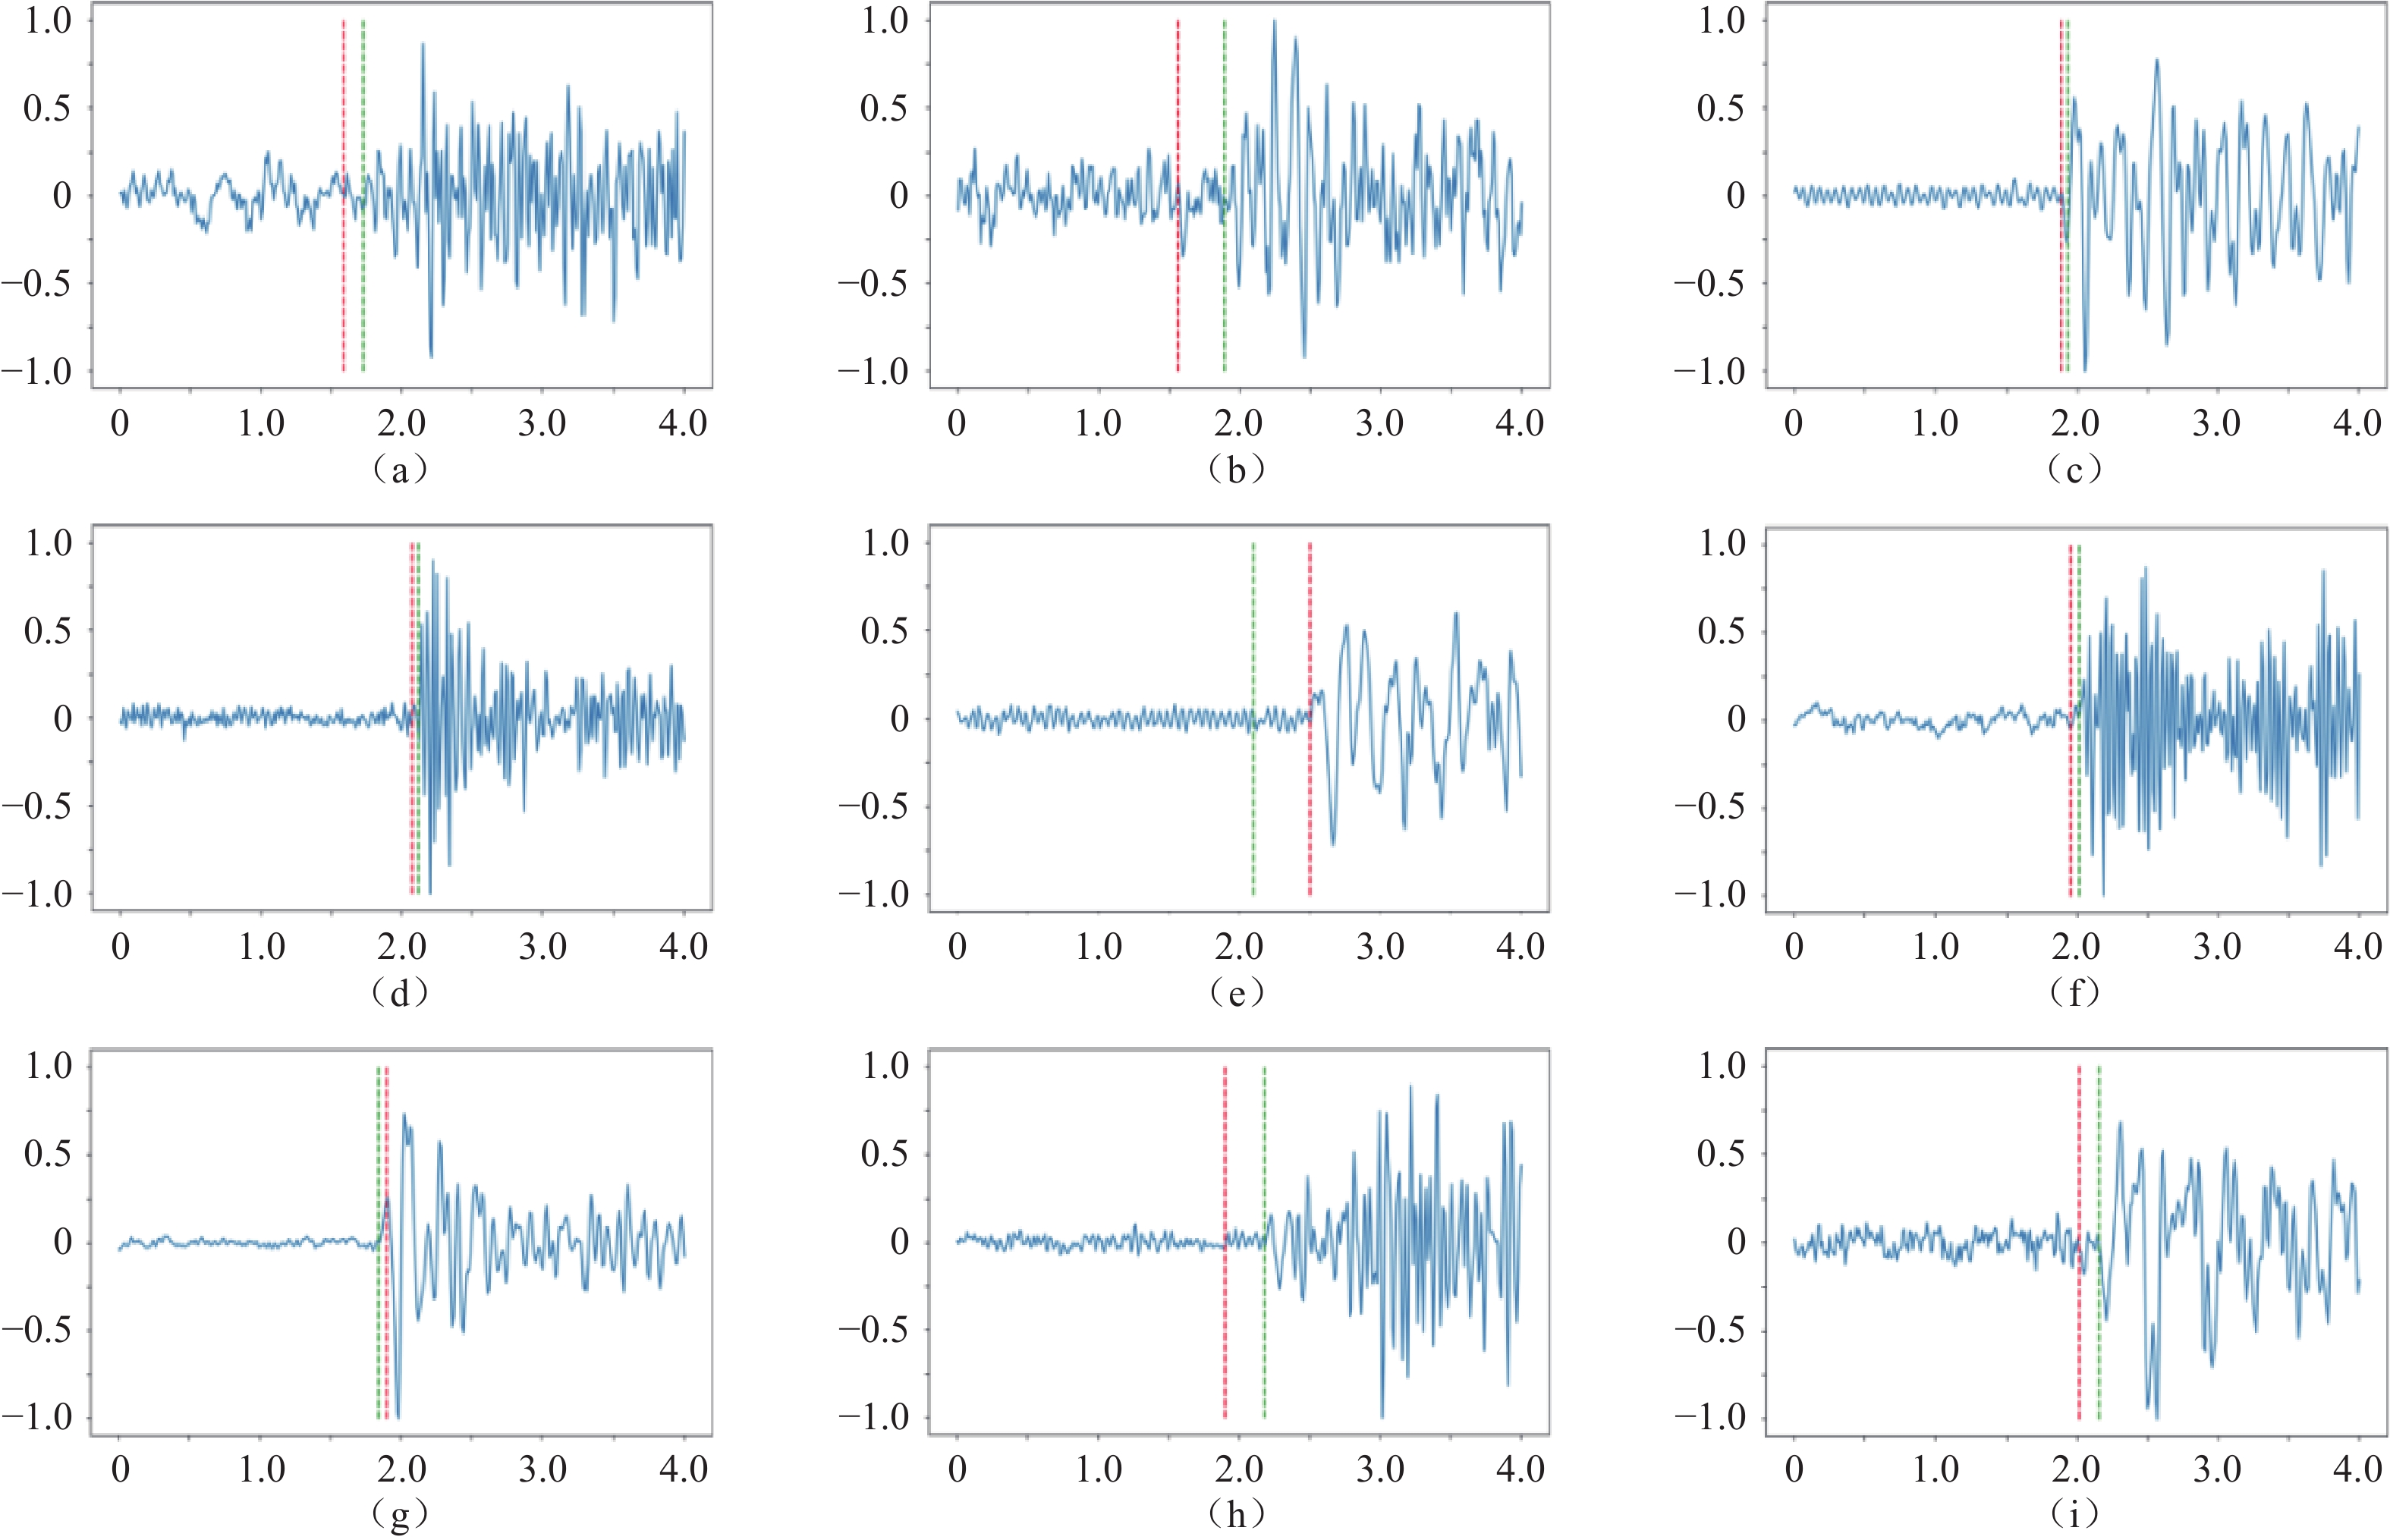
![]() Examples of prediction results for primary phase by CNN
Examples of prediction results for primary phase by CNN
-
![]() Examples of the prediction results of the primary phase by CRNN
Examples of the prediction results of the primary phase by CRNN
-
![]() Examples of the prediction results of the primary phase using the EQtransformer
Examples of the prediction results of the primary phase using the EQtransformer