Figure
2.
Legacy seismic section from a NAZ acquisition
| Citation: |
GAO R T, CHENG Y, TANG Z Q, et al. Data Processing Solutions on Low Signal-to-Noise Data in Loess Plateau Area- A Case Study in Ordos Basin, China[J]. CT Theory and Applications, xxxx, x(x): 1-8. DOI: 10.15953/j.ctta.2025.050.

|
While the Ordos Basin is recognized for its substantial hydrocarbon exploration prospects, its rugged loess tableland terrain has rendered seismic exploration exceptionally challenging[1-3]. Persistent obstacles such as complex 3D survey planning, low signal-to-noise ratio raw data, inadequate near-surface velocity modeling, and imaging inaccuracy have long hindered the advancement of seismic exploration across this region. Through a problem-solving approach rooted in geological target analysis, this research systematically investigates the behavioral patterns of nodal seismometer-based high-density seismic acquisition in loess plateau. Tailored advancements in waveform enhancement and depth velocity modelling methodologies have been engineered. Field validations confirm that the optimized workflow demonstrates marked improvements in amplitude preservation and imaging resolution, offering novel insights for future reservoir characterization endeavors.
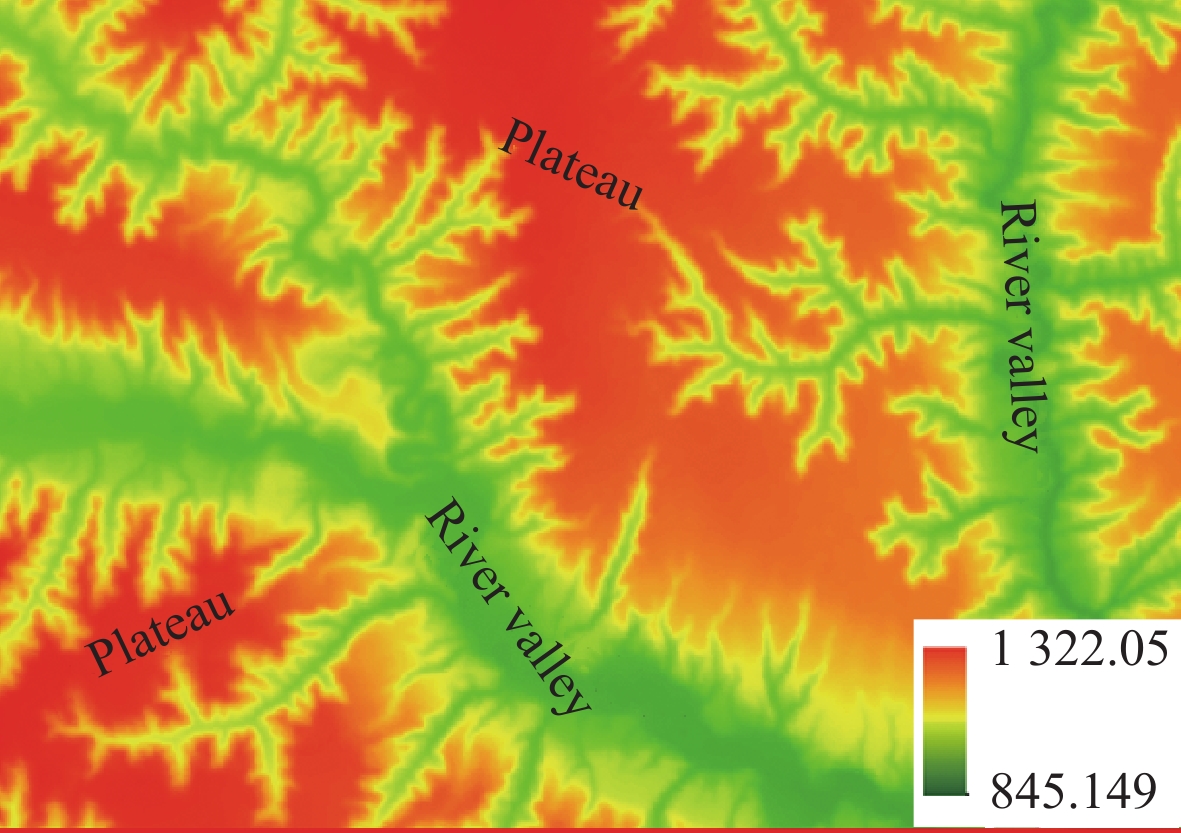
The loess plateau, situated in central-northern China, presents distinctive geomorphic attributes marked by massive loess accumulation (50−300 m thickness), highly dissected landscapes, and abrupt slope variations. As illustrated in Fig. 1, elevation fluctuations within a representative survey area range dramatically between 845 m and
3D seismic survey launched in the early 2000 s employed acquisition geometries featuring restricted offsets, limited fold of coverage, narrow azimuth, and extended receiver arrays. While these configurations partially mitigated operational uncertainties, resultant time-domain images proved inadequate for reservoir delineation owing to compromised signal integrity and spatial resolution.
Two decades of technological evolution in seismic instrumentation, computational infrastructure, and advanced processing workflows have catalyzed transformative innovations in loess exploration methodologies[7]. This study comprehensively reviews cutting-edge acquisition systems, evaluates their data processing implications, develops objective-driven seismic enhancement protocols, validates outcomes through imaging case studies, and concludes with strategic recommendations for future exploration.
In order to achieve thin reservoir prediction and deep small-scale karst reservoir detection, high-quality 3D seismic acquisition technology targeted at complex and thick loess plateau area were put forward and carried out 10 years ago[8].
Based on comprehensive analysis of both geological exploration requirements and geophysical effects, an optimized acquisition scheme was proposed and implemented. The new scheme is characterized by small shot array, appropriate bin size, full azimuth, and high fold of coverage. Detailed acquisition parameters are listed in Table 1 below.
| Acquisition Geometry | 40L5S228T760F |
| Fold of Coverage | 760 |
| Number of Traces | |
| Receiver Line Spacing | 200 m |
| Shot Line Spacing | 120 m |
| Trace Spacing | 40 m |
| Shot Point Spacing | 80 m |
| CMP Grid | 20 m (Crossline) × 40 m (Inline) |
| Min/Max Offset | 28. 28 m/ 6037. 55 m |
 DownLoad:
CSV
DownLoad:
CSV
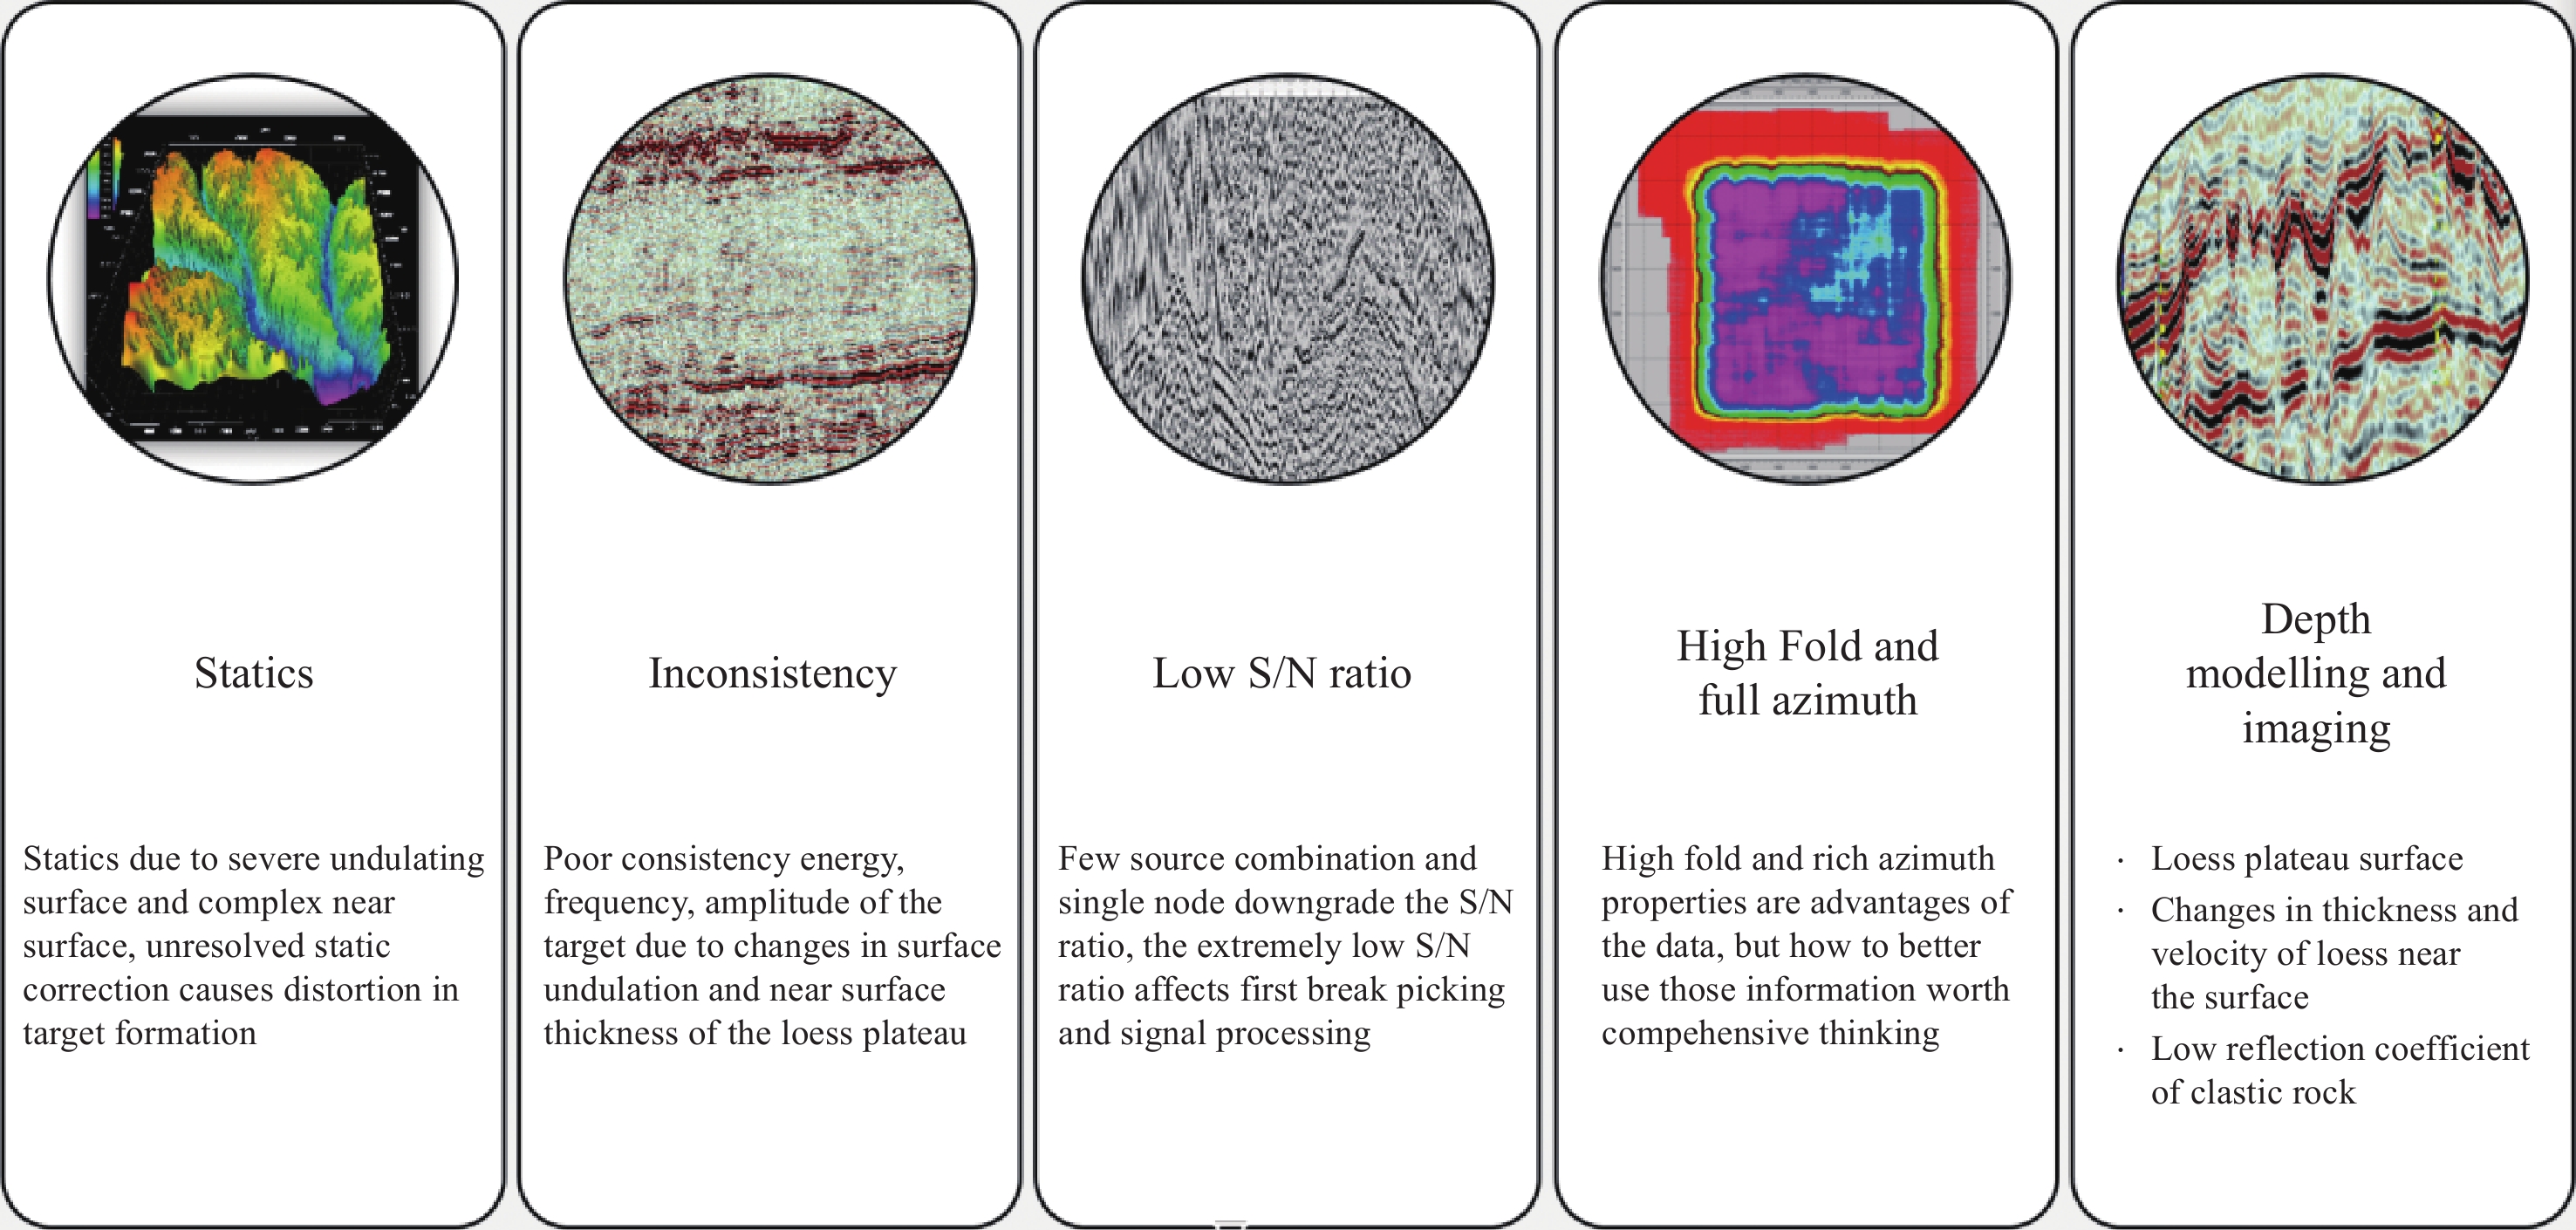
The adoption of key technologies, including vibroseis-dynamite joint broadband shooting and fully nodal seismometer applications, makes it possible to generate seismic data with high shot/trace density, high fold of coverage, and high aspect ratio. On the other hand, the dramatically irregular source locations caused by complex topography lead to strong spatial data inconsistency in both amplitude and wavelet, along with extremely poor signal-to-noise ratio (SNR), as shown in Fig. 3. These data features add to the signal processing difficulty, especially in statics, noise attenuation, surface consistent processing and imaging.
For the acquired seismic data, processing difficulties caused by regional geological conditions remain. In the meanwhile, the extremely low SNR and data inconsistency give rise to additional challenges. After analyzing the new data and reviewing previous research[9]. the key processing issues are summarized in Fig. 4, including first break picking and static correction on low SNR data, vertical and spatial inconsistency issues, and high-precision true surface modeling.
To address these prominent issues of the new data, a complete set of characteristic high-precision static correction and imaging technologies targeted at seismic data in the thick loess plateau area was formed and applied. The key processing strategies and technologies are listed in Fig. 5.
(1) Statics Strategy
The refraction statics calculation itself is not difficult, but the crux of statics lies in appropriate first break picking. Precise static correction can only be achieved when accurate first break information is available. The statics issue in this study is properly solved due to the following two factors.
● Iterative AI first break picking based on seed shots
We found it difficult for common commercial first arrival picking algorithms to determine first breaks accurately owing to the distorted first arrival and its weak energy. An iterative AI first break picking based on seed shots was innovated according. The sparse seed shots were selected, and their first breaks were manually picked first. AI first break picking then runs, with a first round statics generated afterwards. Another round of AI first break picking was implemented on the data with the first round statics applied. This process was iterated several times until satisfying statics was derived.
● Updated idea on statics solving strategy
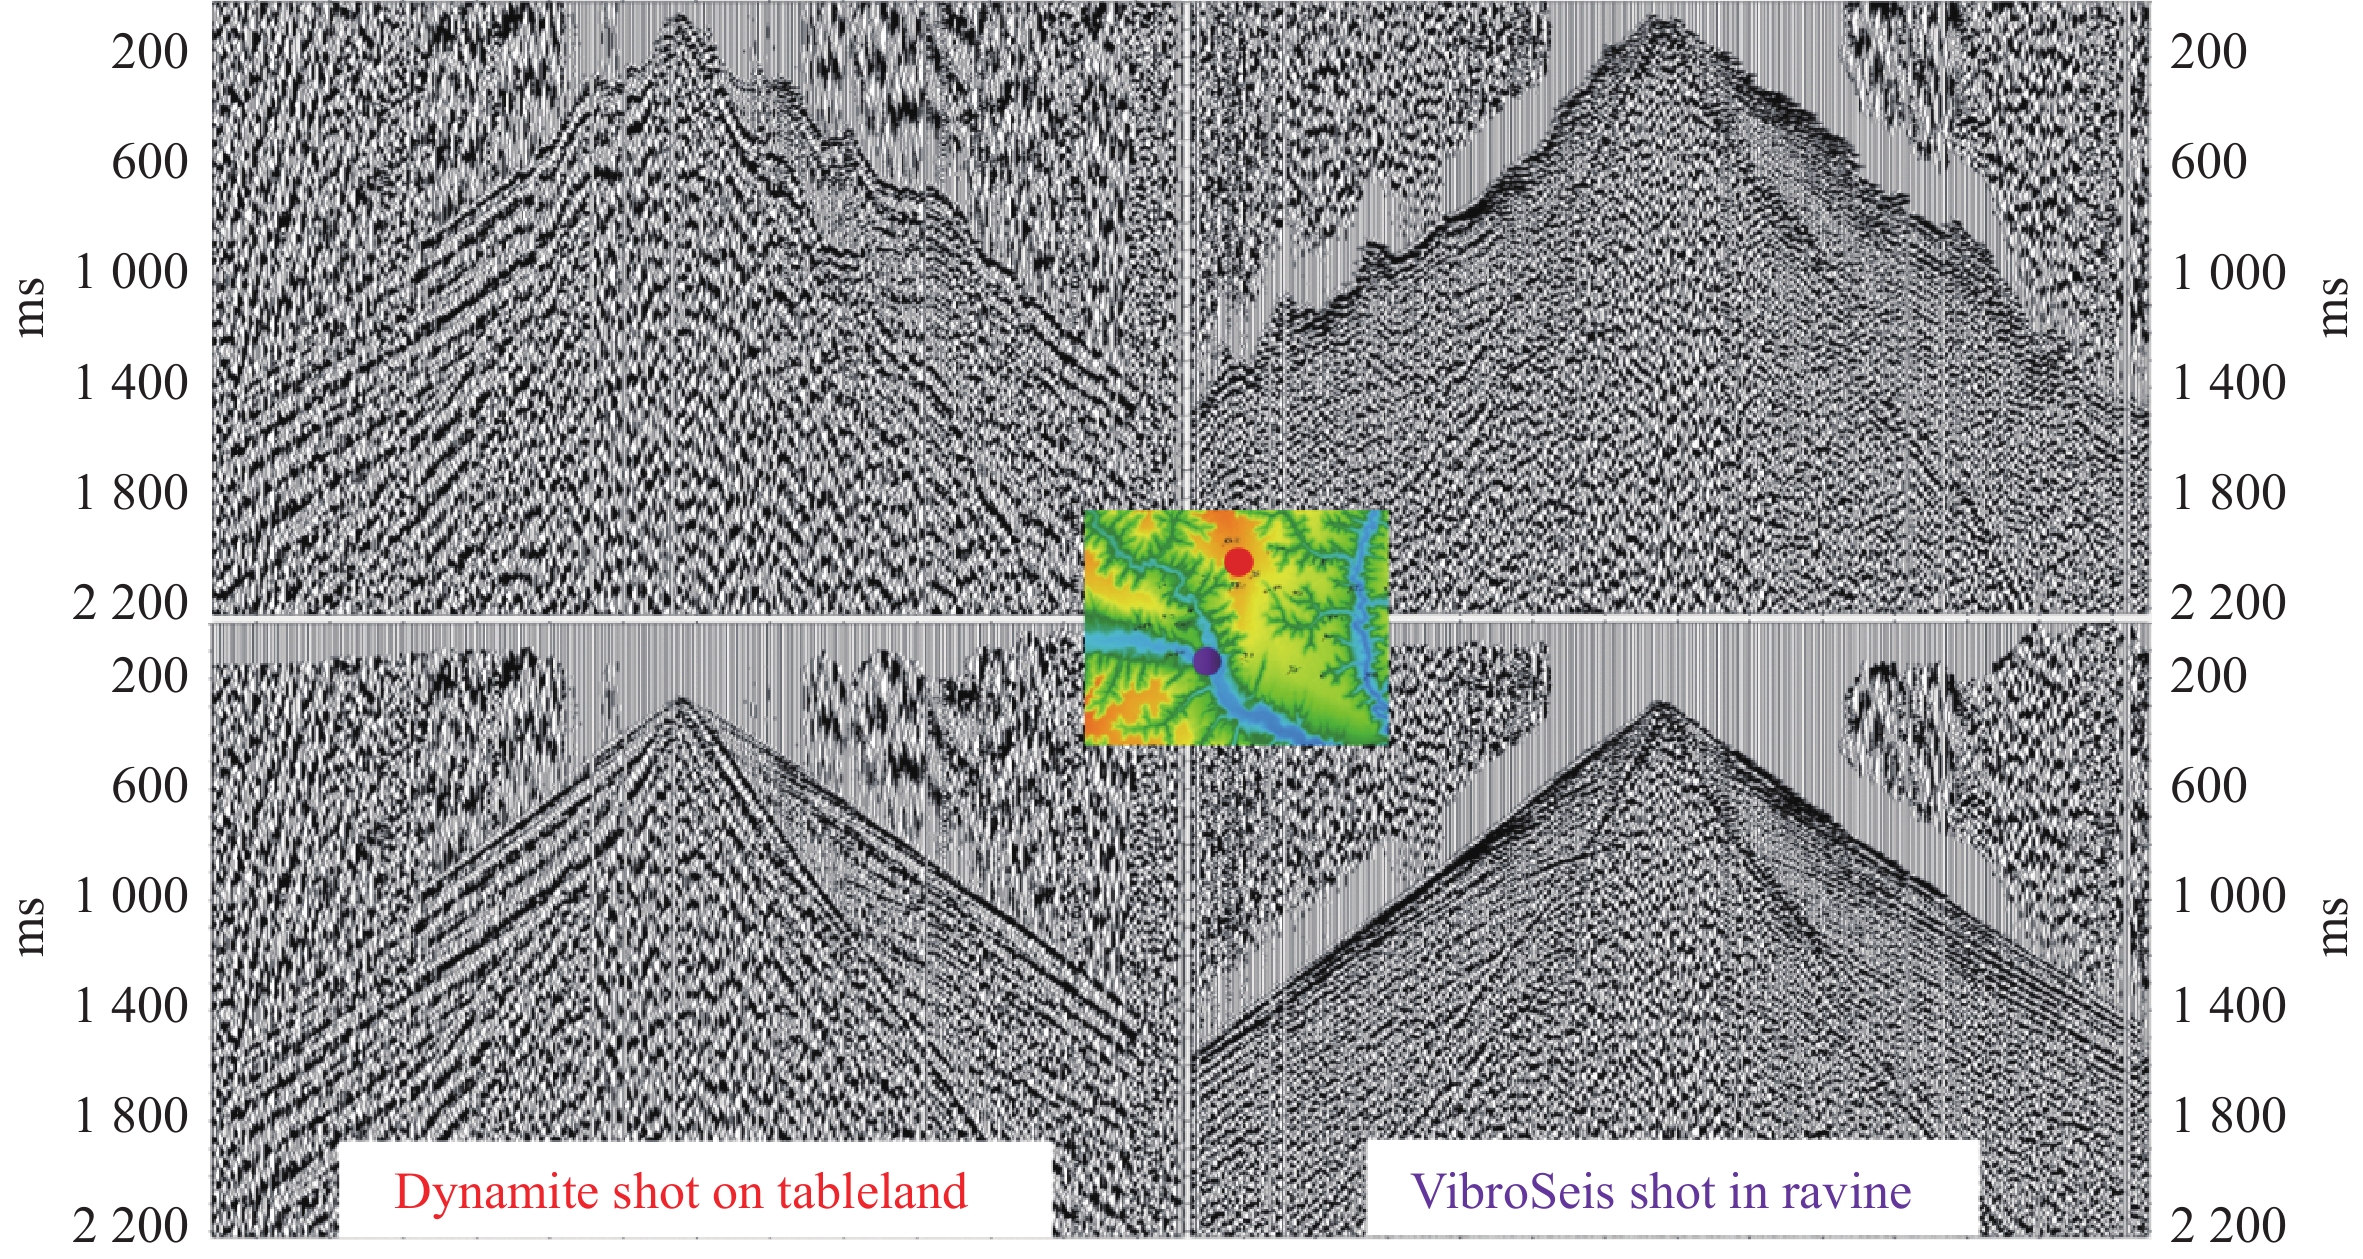
Although the proposed first break picking strategy is effectively implemented, the picking quality is still poor, especially for some vibroseis shots on far offsets. The current picking accuracy is significantly less than the statistical accuracy of conventional dynamite onshore seismic data, which is generally greater than 80%. Considering the specific characteristics of the current data: small shots areal, fully nodal seismometer acquisition, high fold of coverage, and vibroseis-dynamite joint shooting, we propose a new threshold of good quality picks as 60% for this data type. This threshold was obtained after detailed tests. We believe the sufficient data volume would compensate for some of the deficiency of the picking accuracy to a certain degree. The updated idea helps free us from the dilemma of statics issue for extremely low SNR data. Fig. 6 shows the statics correction effects for a typical dynamite shot on the tableland and a vibroseis shot in the ravine.
(2) Improved signal processing ideas and techniques
To improve the SNR of the data, a set of improved signal processing workflows and technologies are designed.
● Innovative approach for target amplitude recovery
Apart from the complex and thick loess layer that result to strong signal absorption, the highly developed Mesozoic coal seams could generate even more severe energy shielding effects on transmission energy, which brings uncertainty to the description of Paleozoic reservoirs, especially in amplitude fidelity. In response to the thickness change and strong shielding effect of the buried coal seams, a surface consistency compensation approach was innovated. The expected outputs of target amplitude and frequency were constructed first. Amplitude compensation factors to compensate for the shielding effect caused by overlying strata were designed[10-11] and applied to achieve true amplitude recovery under coal seams. The RMS amplitude attribute of the target layer indicates a significant improvement in amplitude preservation after the shielding compensation factor was applied, as shown in Fig. 7.
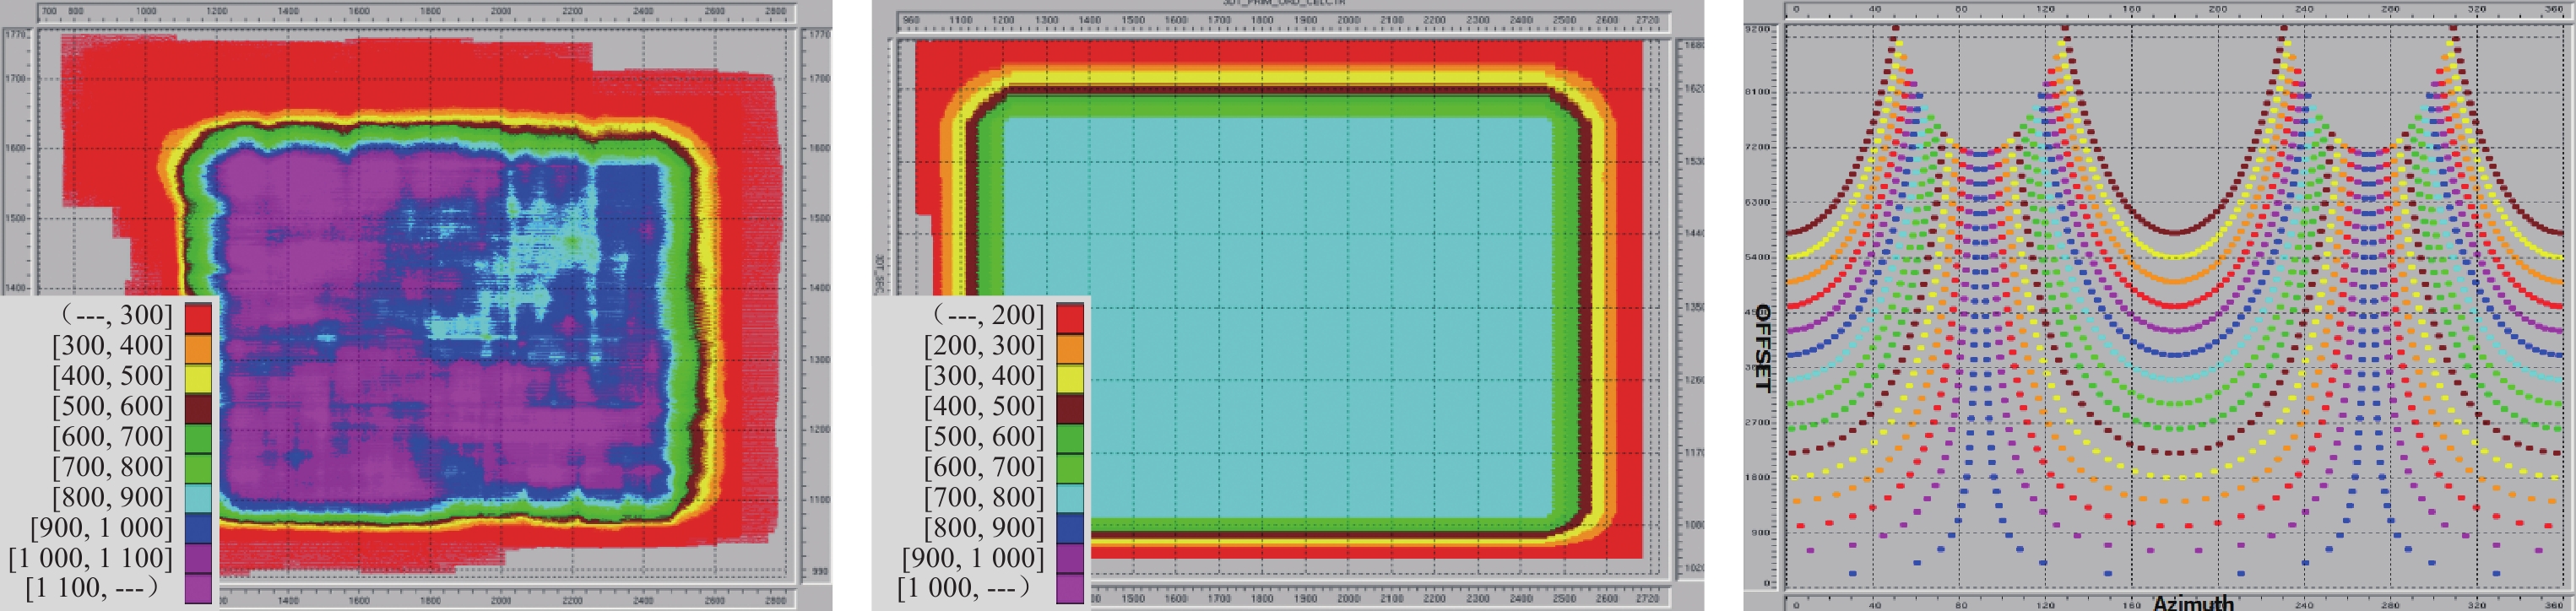
● 5D data regularization to achieve uniform fold and azimuth preservation
The strong irregular distribution of shot points has a negative impact on subsequent offset vector tile (OVT) domain processing, which is of great importance for azimuth and offset preservation. 5D regularization[12] was applied to achieve regularization of surface source/detector locations, uniform coverage and azimuth preservation. Significant improvements can be observed in Fig. 8.
The inherent drawback of time migration, which is the inability to handle strong lateral velocity variations, prevents its successful application in the loess plateau region. Common issues of previous time imaging results include inability to depict deep structures, strong lateral energy inconsistency and well- seismic mismatch. All these problems add to the uncertainty on reservoir characterization of target clastic rock. Only through depth modeling and imaging can we mitigate the uncertainties. However, the complex topography of the loess plateau and the complex near surface with strong uneven spatial and vertical distribution pose additional challenges to depth imaging. Previous depth modeling in similar areas usually starts from the bottom of weathered layer, but the resultant subsurface geological trend cannot be correctly identified, and the depths of seismic events on imaging sections do not match well with well markers.
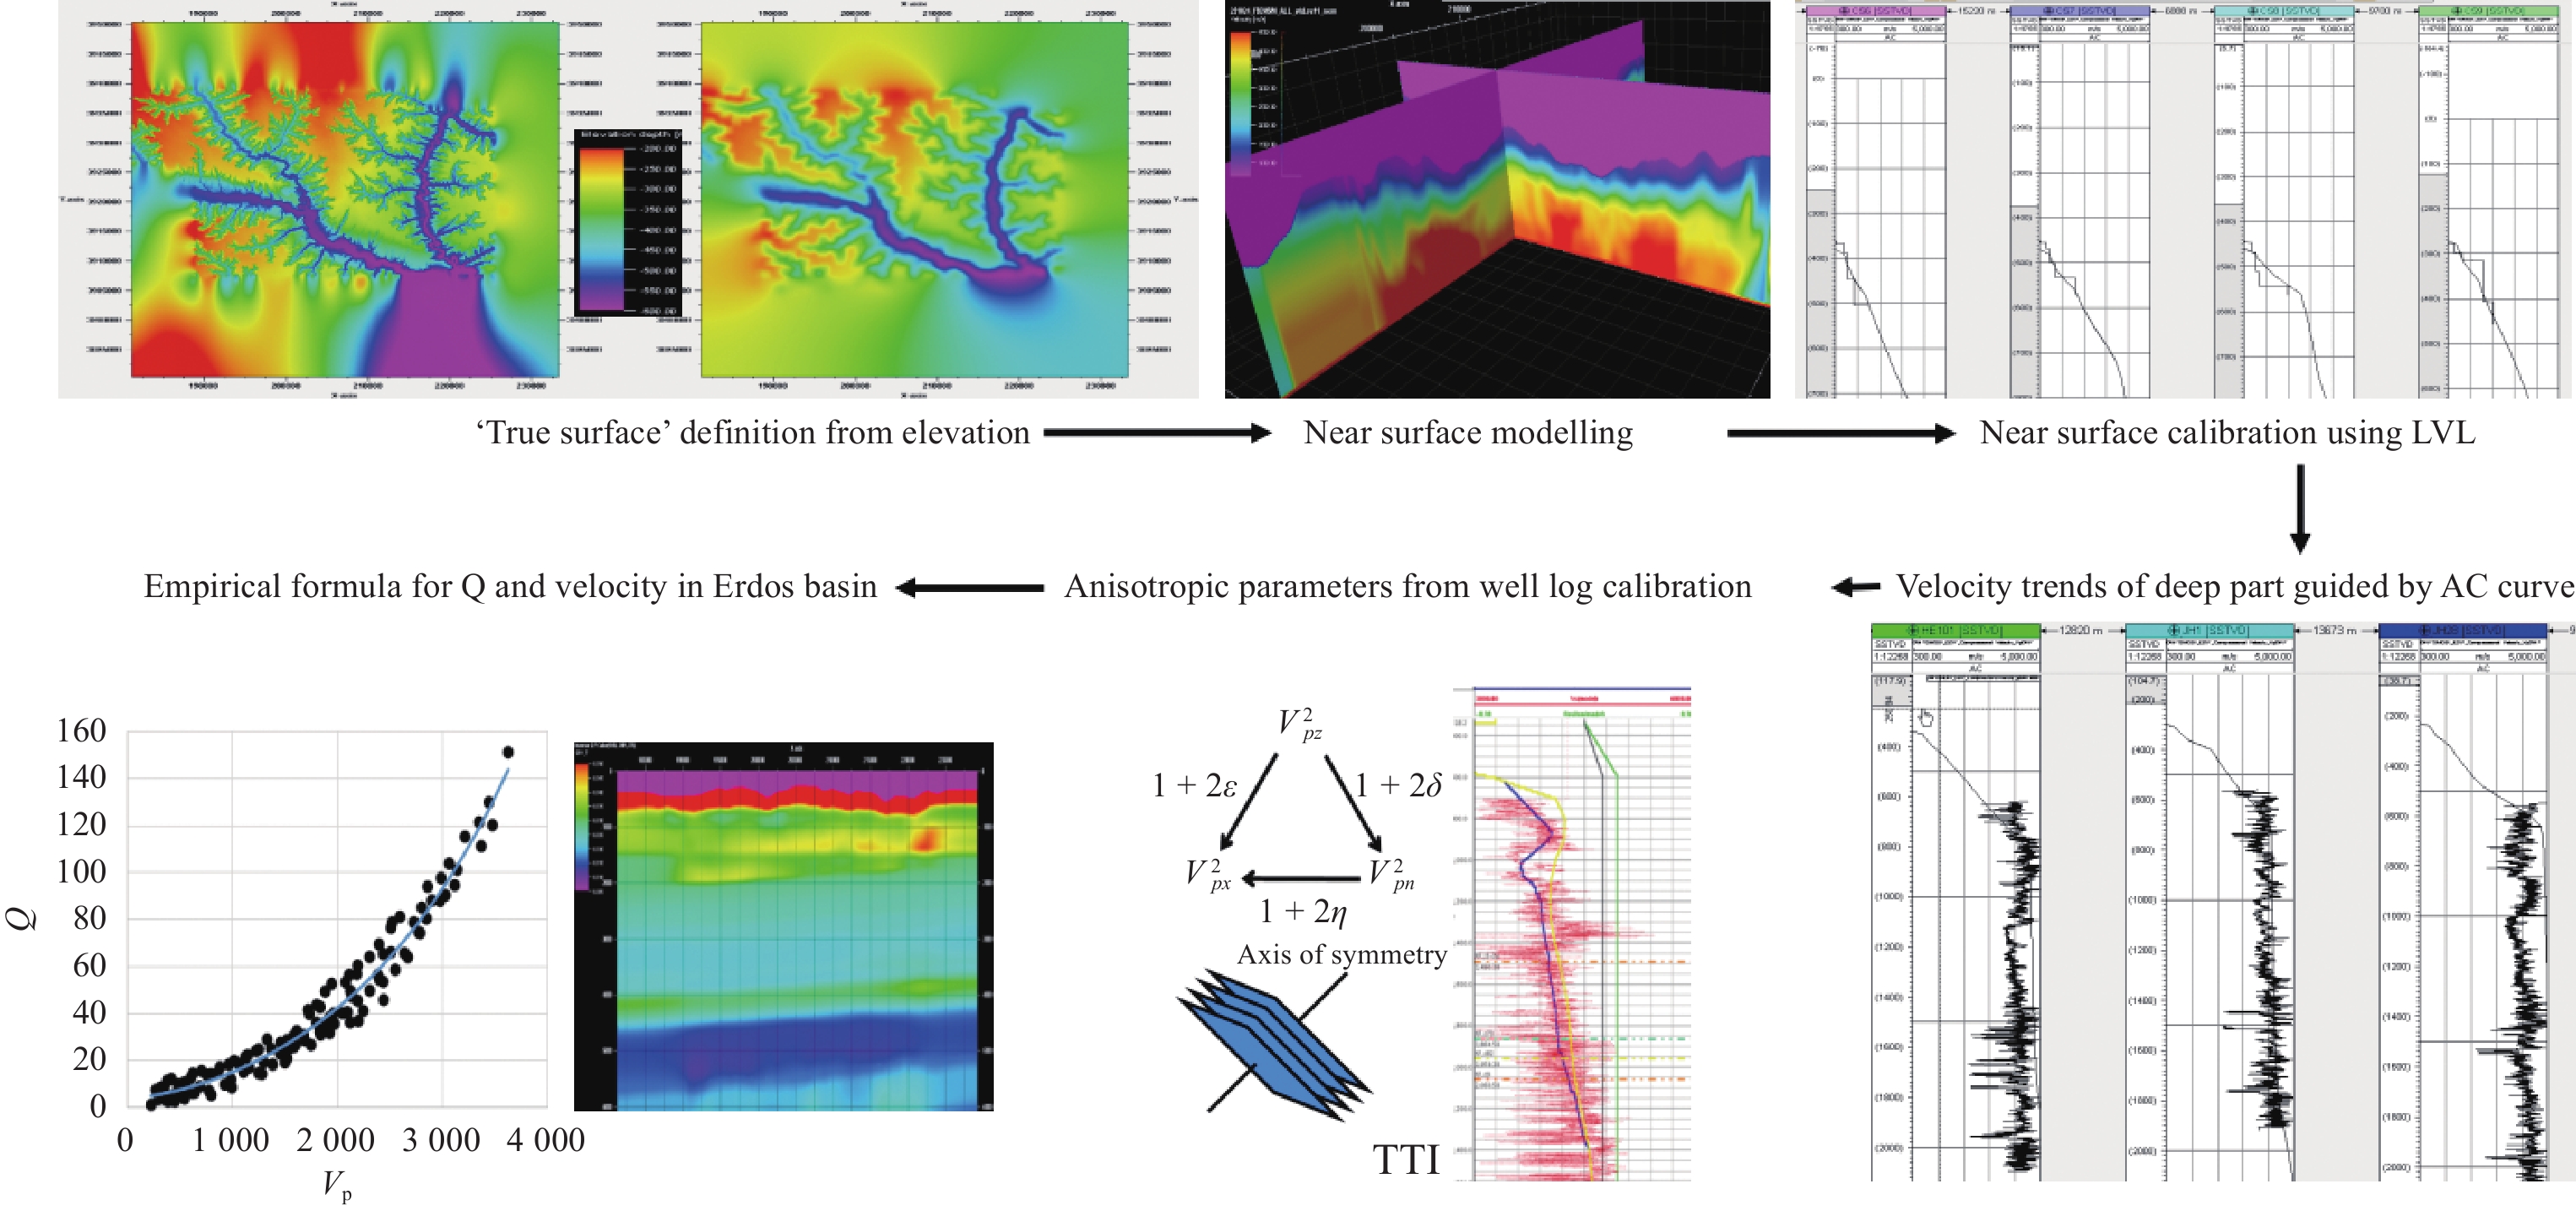
‘True surface’ depth migration solution was formed after comprehensive studies and tests, and the following describes the key procedures:
1) Defining ‘true surface’ /migration surface based on the geometry layout and geology settings;
2) Calculating high-frequency statics which can’t be properly solved by tomography;
3) Applying high-frequency statics to first beak time;
4) Deriving near-surface velocity model through diving wave tomography;
5) Building initial depth model from ‘true surface’.
Through the above processing steps, an initial velocity model considering both the surface and the near-surface issues was obtained, and it’s ready for wide azimuth (WAZ) tomography iterations. The detailed workflow is illustrated in Fig.9.
Implementing updated static correction methodologies and novel signal conditioning workflows enabled effective preparation of OVT-domain seismic data for depth migration. Subsequent refinement of near-surface velocity modeling facilitated the establishment of an detailed “true-surface” velocity model, serving as the foundation for wide-azimuth tomographic inversions. Multi-cycle velocity model iterations yielded both enhanced velocity fields and superior imaging outputs. Comparative analysis in Fig. 10 between conventional time imaging and the updated PSDM sections demonstrates substantial signal-to-noise ratio improvements, enhanced structural coherency, and optimized event continuity. Critical horizon interpretation reliability has been notably elevated through this approach.
Through high-precision velocity modeling and imaging, the seismic-to-well tie accuracy at target horizons was optimized to less than 3‰ (Table 2. ).
| WELL | Well Depth/m | Imaging depth/m | Mis-Tie/m | Mis-tie (‰) |
| W1 | −2861.7 | −2857.6 | 4.1 | 1.43 |
| W2 | −2817.9 | −2813.2 | 4.7 | 1.68 |
| W3 | −2787.9 | −2783.1 | 4.8 | 1.73 |
| W4 | −2763 | −2759.9 | 3.1 | 1.13 |
| W5 | −2614.5 | −2610.5 | 4 | 1.53 |
| W6 | −2605.1 | −2599.8 | 5.3 | 2.03 |
| W7 | −2586.7 | −2581.9 | 4.8 | 1.45 |
DownLoad:
CSV
The seismic processing workflow strictly adhered to data fidelity principles, ensuring that AVO responses in seismic gathers align with geological interpretations and well-logging observations, Fig. 11. shows the AVO response of the seismic gather is consistent with that of the well logging forward modeling
The high-fidelity imaging and pre-stack gather deliverables enabled enhanced reservoir characterization and prospect delineation, the structural interpretation workflow precisely reconstructed paleogeomorphic configurations prior to sediment deposition. High-resolution sequence stratigraphic slicing techniques delineated favorable fluvial depositional architectures by quantifying three-dimensional geometric variations. Confronted with the challenges of thin distributary channel reservoirs and ambiguous P-impedance contrasts in target zones, the team implemented a novel pre-stack elastic inversion framework guided by seismic facies analysis. This approach, empowered by azimuthally-rich pre-stack gathers, achieved robust predictions of reservoir geometry and gas-bearing sweet spots, with post-drilling validations confirming 85% accuracy in sand thickness estimation and 75% reliability in gas saturation delineation.
Five exploratory well locations were prioritized, with three drilling trajectories being dynamically optimized through real-time geological feedback. Synergistic advancements in subsurface interpretation protocols and technical workflows have substantially boosted operator confidence in unlocking the Ordos Basin’s hydrocarbon potential.
The entire set of processing sequences formed in this study has great reference value and is worth popularizing for the seismic exploration of the loess plateau. It also provides guidelines for the processing of seismic data acquired through nodal seismometers in other complex onshore areas. Some practical solutions have been mentioned in the paper to alleviate data inconsistency issues, but further studies are required for better effects. More advanced and practical near-surface modeling approaches are highly expected in the loess plateau region, such as full waveform inversion for land.
Seismic exploration in loess plateau areas presents extreme technical challenges and heavily relies on high-quality seismic data. Currently, numerous domestic researchers are engaged in processing loess plateau seismic data through approaches such as: AI-optimized first-break picking[13]. High-precision near-surface Q estimation[14]. Q model construction and migration[15] etc. These efforts aim to enhance seismic data resolution and broaden frequency bandwidth. However, fidelity preservation processing of seismic data and consistency processing of target layers in loess plateau areas prove more critical for predicting tight thin reservoirs and hydrocarbon identification. Meanwhile, recent achievements in joint surface-borehole exploration[16] will contribute to advancing geological understanding of loess plateau exploration, so there is still a long way to go to fully resolve the exploration of the loess plateau. Nevertheless, the following studying areas also require urgent implementation: paleogeomorphic environment analysis during hydrocarbon accumulation in Ordos Basin, identification of favorable source rocks, refined prediction methods for hydrocarbon-bearing sweet spots, Optimization of unconventional hydrocarbon development schemes.
Acknowledgement: The authors would like to thank Sinopec North China Petroleum Bureau for initiating and supporting the Loess Plateau prospecting projects.
| [1] |
胡文瑞, 鄂尔多斯盆地油气勘探开发理论与技术[M]. 石油工业出版社, 北京, 2000: 1-15
HU W R. Theory and technology of oil and gas exploration and development in Ordos Basin[M]. Beijing: Petroleum Industry Press, 2000: 1-15. (in Chinese).
|
| [2] |
YANG H, FU S T, WEI X S. Geology and exploration of oil and gas in Ordos Basin[J]. Applied Geophysics, 2004, 1(2): 103-109. DOI: 10.1007/s11770-004-0011-3.
|
| [3] |
WANG D X. Progress challenges and technical requirements of 3D seismic exploration in the loess tableland of the Ordos Basin[J]. Geopysical Prospecting for Petroleum, 2024, 63(3): 517-534. DOI: 10.12431/issn.1000-1441.2024.63.03.001. (in Chinese).
|
| [4] |
程建远, 李宁, 侯世宁等, 黄土塬地震勘探技术发展现状综述[J]. 中国煤炭地质, 2009, 21(12): 73-76.
CHENG J Y, LI N, HOU S N, et al. Development Status Overview of Seismic Prospecting Technology in Loess Tableland[J]. Coal Geology of China, 2009, 21(12): 73-76. (in Chinese).
|
| [5] |
FU J H, DONG G D, ZHOU X P, et al. Research progress of petroleum geology and exploration technology in Ordos Basin[J]. China Petroleum Exploration, 2021, 26(3): 19-40. (in Chinese).
|
| [6] |
杜向东. 鄂尔多斯盆地黄土塬致密砂岩油气藏地震勘探技术新进展[C]//国际油气田勘探开发论坛, 2019: 4470.
DU X D. New progress in seismic exploration technology for tight sandstone reservoirs in loess plateau of Ordos basin[C]//nternational Field Exploration and Development Conference, 2019: 4470(in Chinese).
|
| [7] |
LIU B, DONG X G, et al. Key technology of high density seismic exploration in loess plateau of Southern Ordos Basin[J]. Science Technology and Engineering, 2023, 23(11): 4536-4543. DOI: 10.12404/j.issn.1671-1815.2023.23.11.04536. (in Chinese).
|
| [8] |
WANG X Z, ZHANG L X, LIANG Q S, et al, Full-azimuth, high-density, 3D point-source/point-receiver seismic survey for shale gas exploration in a loess plateau: A case study from the Ordos basin[J]. First break, 2014, 32: 105-112.
|
| [9] |
王猛. 黄土塬地区中生界地震资料应用的问题和思考[J]. 中国石油大学胜利学院学报, 2018, 32(4): 9-15.
WANG M, Problems and Thoughts on the application of Seismic Data in the Loess Plateau Area[J]. Journal of Shengli College China University of Petroleum, 2018, 32(4): 9-15. (in Chinese).
|
| [10] |
HART D I, HOOTMAN B W, JACKSON A R. Modeling the seismic wavelet with model-based wavelet processing[C]//71st Ann. Internat. Mtg. , Soc. Expl. Geophysics, Expanded Abstracts, 2011, 1823-1826.
|
| [11] |
SAGGAF M M, ROBINSON E A. A unified framework for the deconvolution of traces of nonwhite reflectivity[J]. Geophysics, 2000. 65 1660–1676.
|
| [12] |
NGUYEN T. WINNETT R. Seismic interpolation by optimally matched Fourier components[C]//81st Annual International Meeting, SEG, Expanded Abstracts, 2011, 3085-3089.
|
| [13] |
王宁, 常艳粉, 胡亚东, 等. AI 初至拾取技术在黄土塬地震资料中的研究与应用[C]//第二界中国石油勘探学术年会, 2024: 558-561.
WANG N, CHANG Y F, HU Y D, et al. Research and application of AI-based first-break picking technology in loess tableland, The 2nd Annual China Petroleum Geophysics Conference, 2024: 558-561. (in Chinese).
|
| [14] |
XIA C L, DAI H T, LI G Q, et al. The calculation and application of a near surface Q value model based on dual-well micrologs for a loess plateau area[J]. Geophysical and Geochemical Exploration, 2024, 48(3): 698-704. (in Chinese).
|
| [15] |
XU W, LIU H X, MI H G, et al. High-precision Q modeling and Q migration technology and its applications in loess plateau regions, Applied Geophysics, Vol. 21, 2024(4): 835−847.
|
| [16] |
LIU J B, XIE Y G, WANG S W, et al. Field test study of cross-well seismic in the loess plateau area of Ordos Basin[J], IFEDC, 2024: 17041.
|
| [1] | Bu Chonghang, Zhang Jiajia, Zhang Guangzhi, Hu Yongze, Zhao Xinke. Turbidite Sandstone Miscible Rock Physical Modeling and Time-lapse Seismic Forward Modeling Analysis[J]. CT Theory and Applications. DOI: 10.15953/j.ctta.2025.048 |
| [2] | QIN Liming, CHENG Zhiguo, ZHENG Wei, CHEN Yong, SU Yanli, SHEN Jianwen, SONG Jianguo. Rock Physics Modeling and Fracture Prediction of Double Porosity Media in the Hutubi Area[J]. CT Theory and Applications, 2023, 32(6): 723-734. DOI: 10.15953/j.ctta.2023.117 |
| [3] | ZHU Yuanzheng, LV Qiwen, GUAN Yu, LIU Qiegen. Low-dose CT Reconstruction Based on Deep Energy Models[J]. CT Theory and Applications, 2022, 31(6): 709-720. DOI: 10.15953/j.ctta.2021.077 |
| [4] | LI Lisheng, WANG Zhaoqi, DING Liangbo, XU Zhicheng, YE Yueming, CHEN Jianwei. Diving Wave Tomography and Reflection Tomography for PSDM Velocity Model Building of Complex Depth Imaging in Loess Tableland Area of Western Edge of Ordos Basin[J]. CT Theory and Applications, 2021, 30(4): 417-424. DOI: 10.15953/j.1004-4140.2021.30.04.02 |
| [5] | WANG Hong-wei, FENG Shao-ying, WANG Sheng-yang, SONG Wei, WEI Xue-qiang, TIAN Yi-ming. The Design of Portable Seismic Acquisition Software in the Complex Terrain[J]. CT Theory and Applications, 2018, 27(3): 339-348. DOI: 10.15953/j.1004-4140.2018.27.03.06 |
| [6] | ZHOU Han-rui, SONG Jian-guo, GONG Yun-liang. Effectiveness Analysis of Forward Modeling and Ghost Suppression for Two Kinds of Variable-depth Streamer Acquisitions[J]. CT Theory and Applications, 2016, 25(3): 319-330. DOI: 10.15953/j.1004-4140.2016.25.03.08 |
| [7] | MAO Li-feng. Conductivity-depth Imaging Algorithm for Central-loop Helicopter TEM[J]. CT Theory and Applications, 2013, 22(3): 429-437. |
| [8] | SUN Qi-feng, BAI Qing-yun. Depth Migration Based on Arbitrarily Wide-Angle Wave Equation with Parameters Optimization[J]. CT Theory and Applications, 2011, 20(1): 29-38. |
| [9] | ZHANG En-jia, WANG Xi-chong, LIANG Dong, TANG Xiao-biao. Beamlet Pre-Stack Depth Migration Based on Gabor Frame Theory[J]. CT Theory and Applications, 2009, 18(3): 38-45. |
| [10] | AN Fen-ju. Study on the Establishment of Dental Models Based on Three-Dimensional CT and MEM Technology[J]. CT Theory and Applications, 2008, 17(3): 13-17. |
Figures(11) / Tables(2)
Supported by: Beijing Renhe Information Technology Co. Ltd 
| Acquisition Geometry | 40L5S228T760F |
| Fold of Coverage | 760 |
| Number of Traces | |
| Receiver Line Spacing | 200 m |
| Shot Line Spacing | 120 m |
| Trace Spacing | 40 m |
| Shot Point Spacing | 80 m |
| CMP Grid | 20 m (Crossline) × 40 m (Inline) |
| Min/Max Offset | 28. 28 m/ 6037. 55 m |
DownLoad:
CSV
| WELL | Well Depth/m | Imaging depth/m | Mis-Tie/m | Mis-tie (‰) |
| W1 | −2861.7 | −2857.6 | 4.1 | 1.43 |
| W2 | −2817.9 | −2813.2 | 4.7 | 1.68 |
| W3 | −2787.9 | −2783.1 | 4.8 | 1.73 |
| W4 | −2763 | −2759.9 | 3.1 | 1.13 |
| W5 | −2614.5 | −2610.5 | 4 | 1.53 |
| W6 | −2605.1 | −2599.8 | 5.3 | 2.03 |
| W7 | −2586.7 | −2581.9 | 4.8 | 1.45 |
DownLoad:
CSV