
 Download:
Plan views of the tomographic results obtained in this study
Figures of the Article
-
![]() Geological background in the study region
Geological background in the study region
-
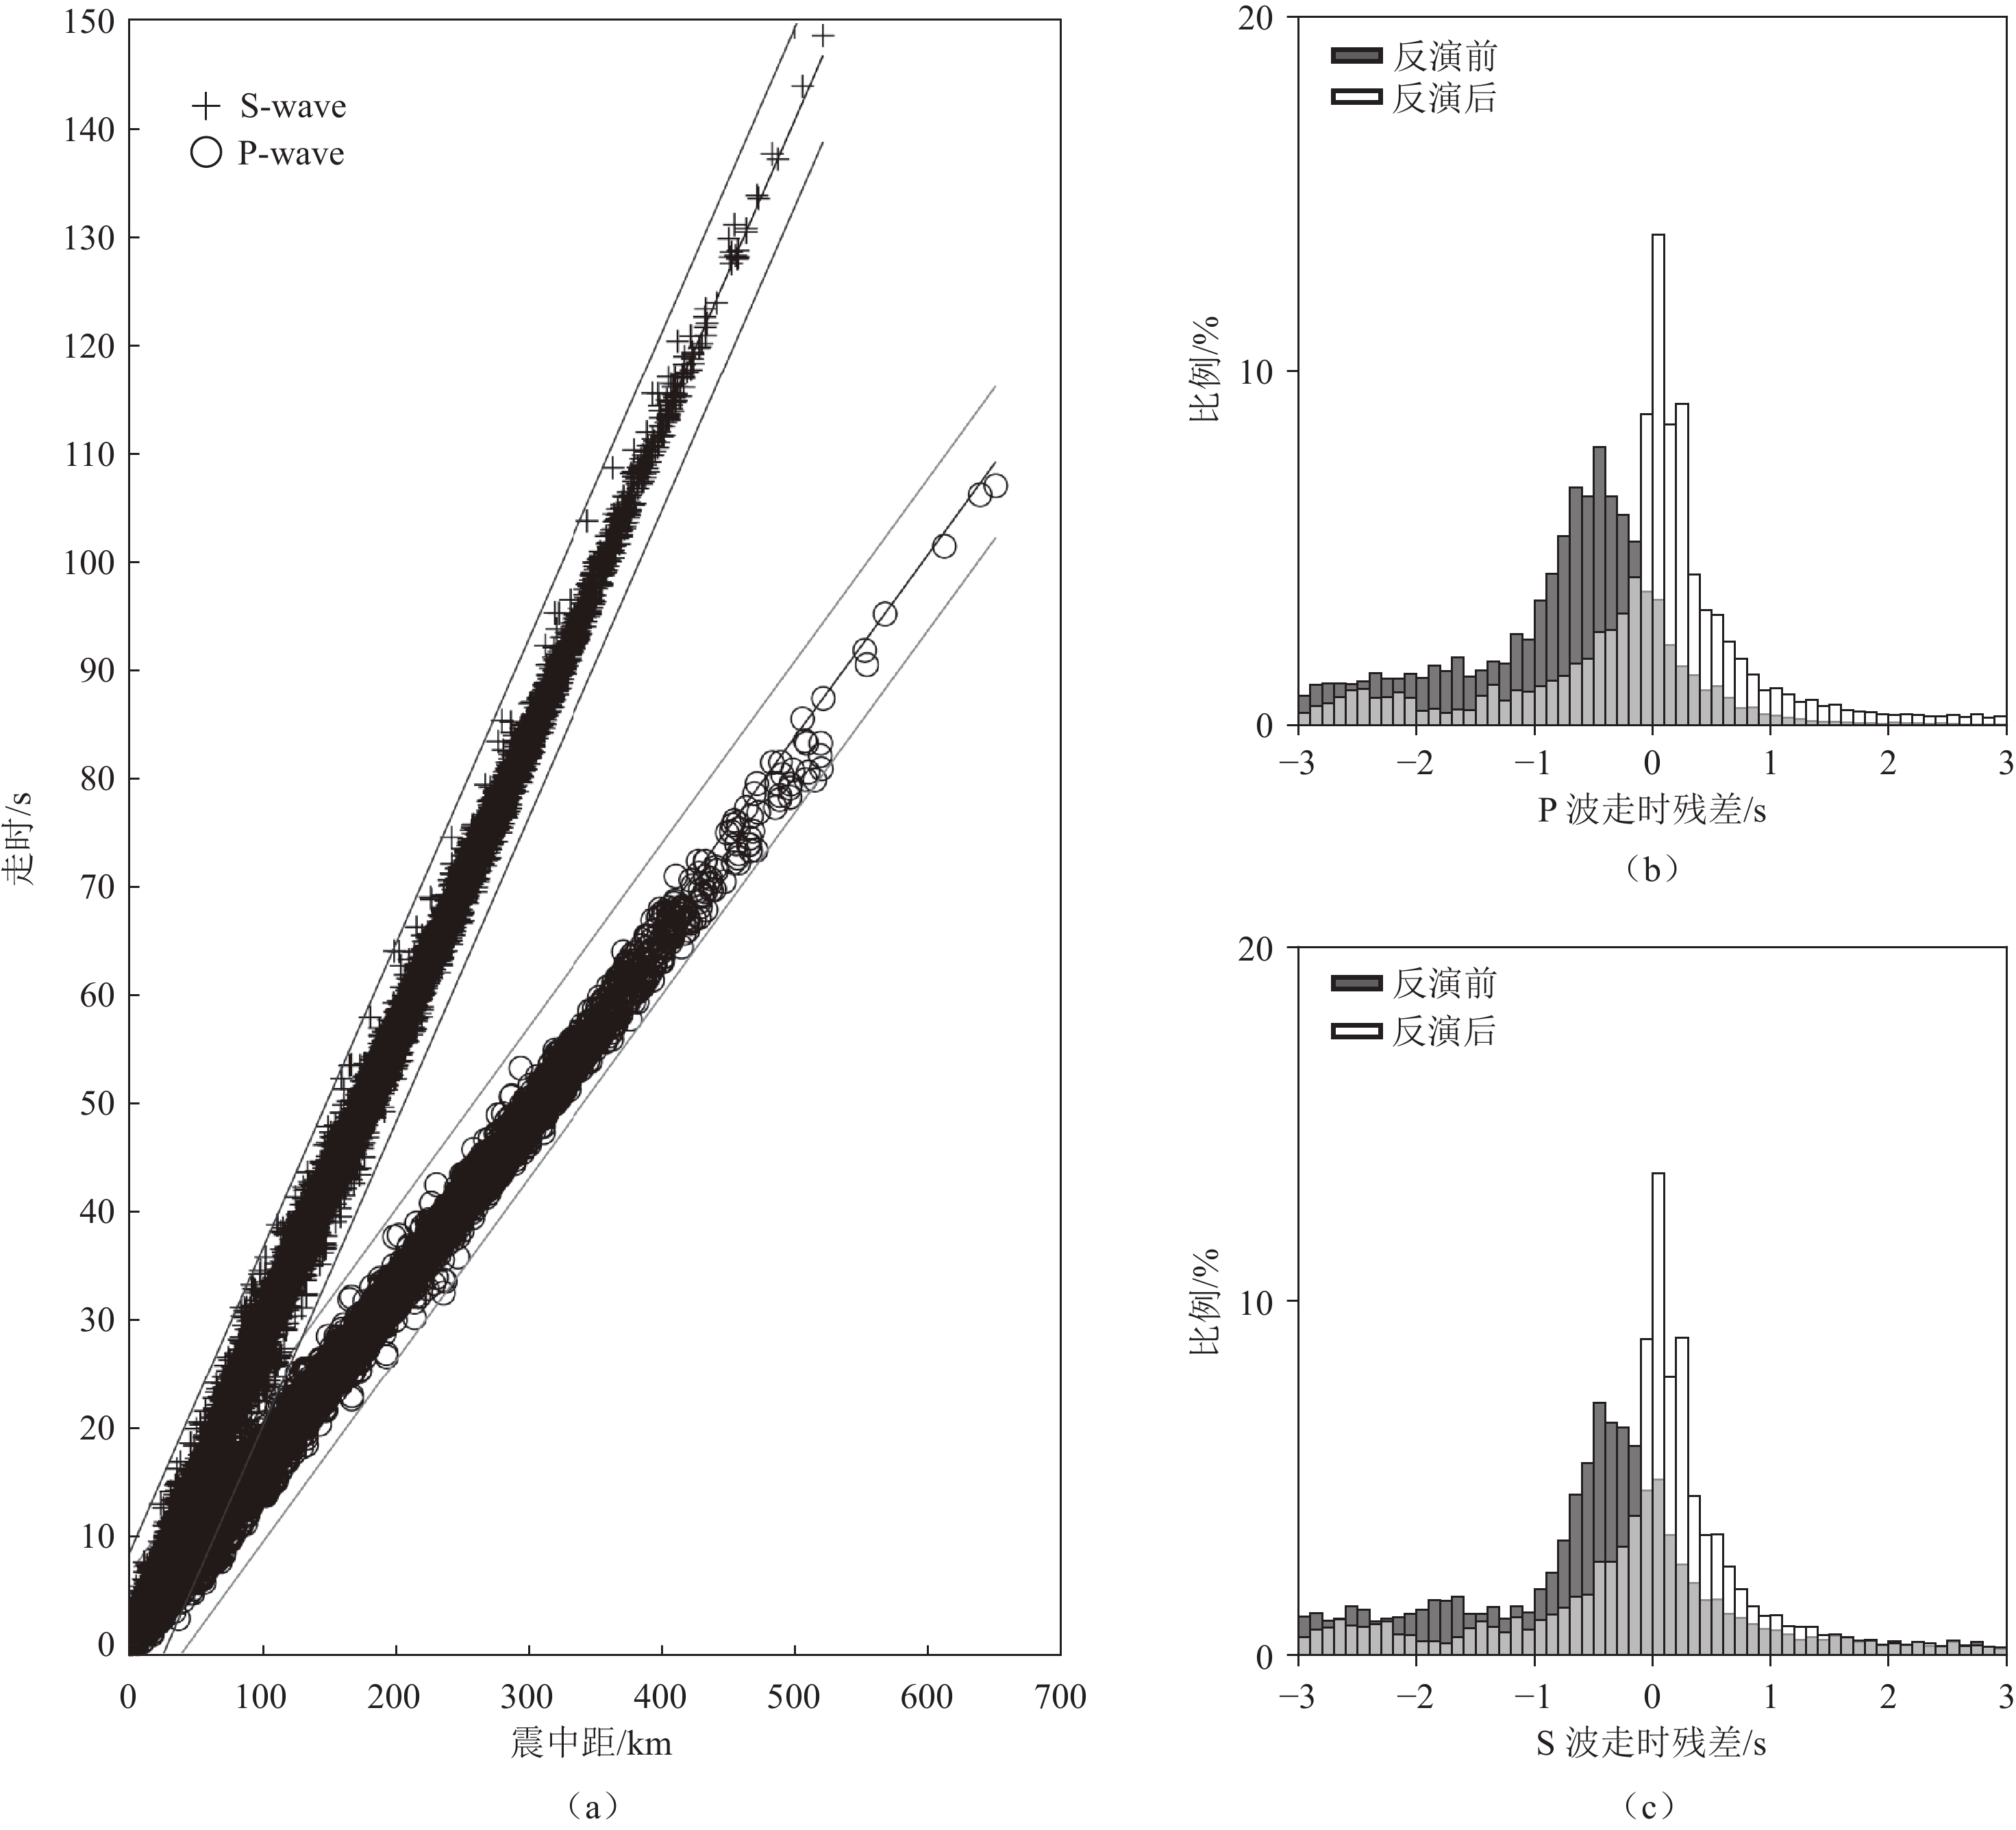
![]() Distributions of the primary phase data and travel-time residuals before and after the inversion of the P- and S-wave data
Distributions of the primary phase data and travel-time residuals before and after the inversion of the P- and S-wave data
-
![]() Distribution of the earthquakes that occurred during January 2010 to December 2020 in the study region
Distribution of the earthquakes that occurred during January 2010 to December 2020 in the study region
-
![]() Results of the checkerboard resolution tests for (a)~(c) P-wave and (d)~(f) S-wave tomography
Results of the checkerboard resolution tests for (a)~(c) P-wave and (d)~(f) S-wave tomography
-
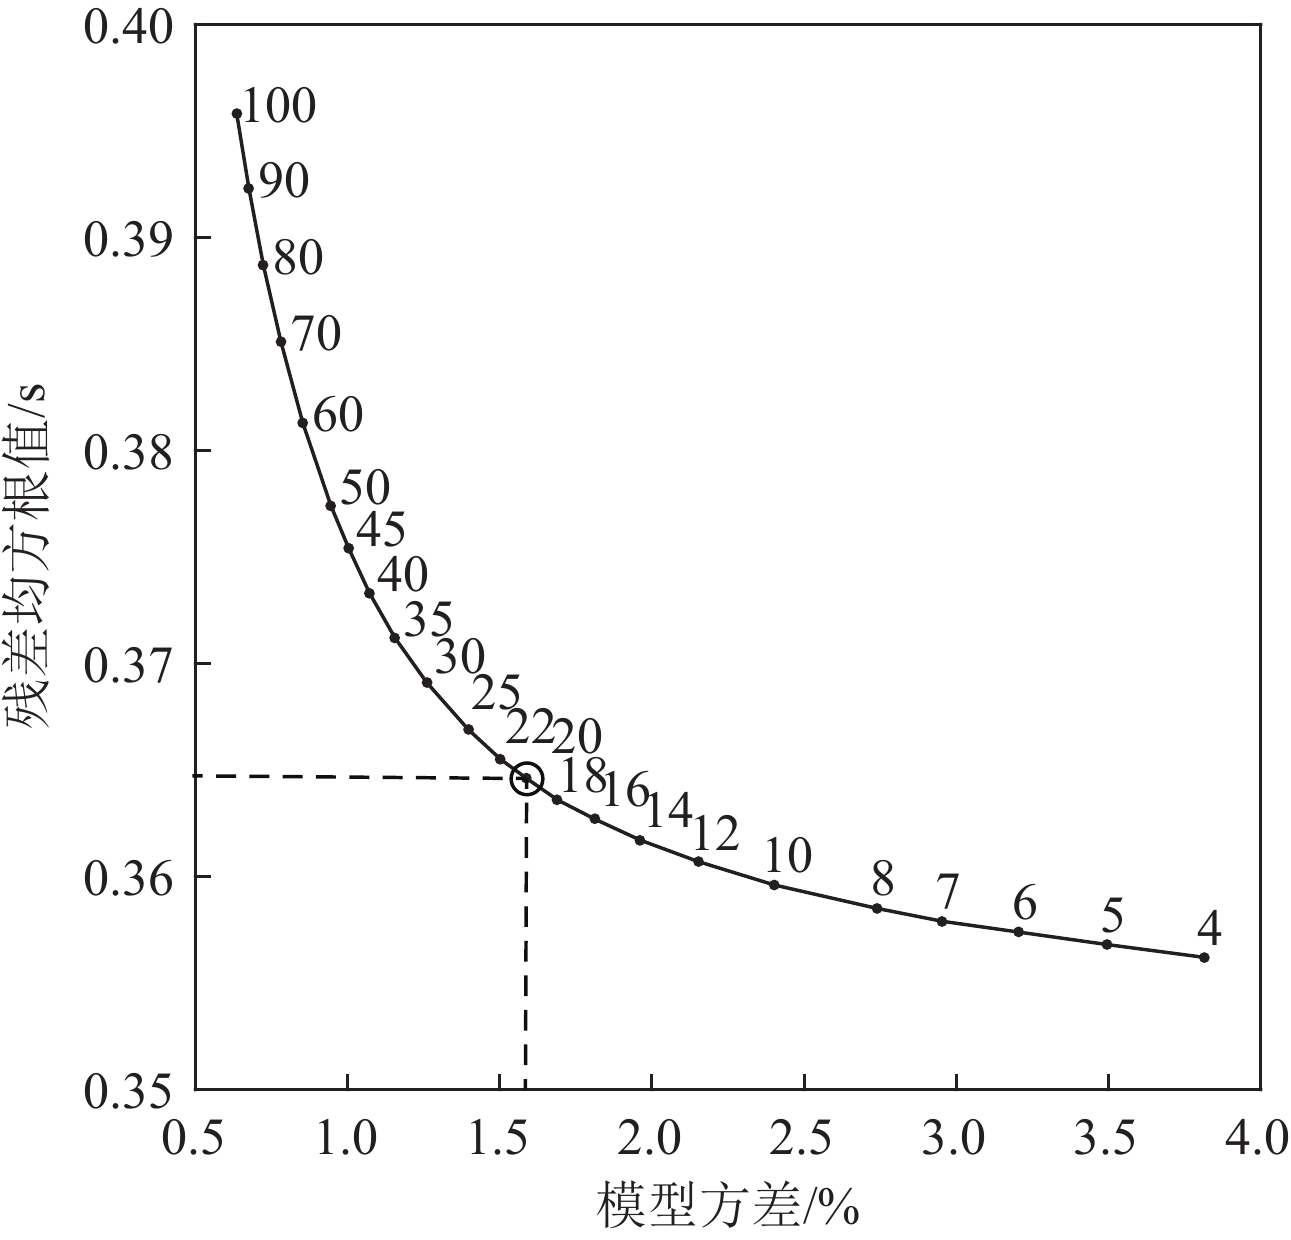
![]() Trade-off curve between the model variation and the travel-time residual for the optimal damping value
Trade-off curve between the model variation and the travel-time residual for the optimal damping value
-
![]() Plan views of the tomographic results obtained in this study
Plan views of the tomographic results obtained in this study
-
![]() Vertical cross-sections of velocity tomography results along different profiles of AA'-FF'
Vertical cross-sections of velocity tomography results along different profiles of AA'-FF'
-
![]() Results of the restored test conducted in the present study
Results of the restored test conducted in the present study


Related articles
-
2025, 34(3): 359-368. DOI: 10.15953/j.ctta.2025.001
-
2023, 32(6): 777-782. DOI: 10.15953/j.ctta.2022.148
-
2021, 30(6): 691-700. DOI: 10.15953/j.1004-4140.2021.30.06.04
-
2015, 24(6): 793-799. DOI: 10.15953/j.1004-4140.2015.24.06.04
-
2013, 22(2): 207-213.
-
2010, 19(2): 53-30.
-
2008, 17(1): 1-6.
-
2007, 16(2): 8-13.
-
2005, 14(1): 11-16.
